Refinitiv RTDS
Overview Copied
Geneos configuration templates are available for monitoring the Refinitiv Real-Time Distribution System (RTDS) platform. The integration provides a set of configuration files, dashboards, and tools that enable out-of-the-box monitoring of the RTDS platform and related applications through preconfigured Managed Entities and types.
Package Contents Copied
The integration package geneos-integration-rtds-<version>.zipcan be downloaded from ITRS Downloads site and contains the following:
GLOBAL_Geneos.xml— Gateway include file containing configurations for hardware monitoring.Note
This also includes some default configurations used in the application monitoring, so it is recommended to load this include file even if you are not monitoring your hardware.RTDS.xml— Gateway include file containing a structured Managed Entities tree with pre-defined types. The Attributes used are the following:Platform— for the overall business such as RTDS or Hardware.Component— for the individual components such as Linux, ADH, ADS, etc.
RTDS1.adb— Dashboard that is configured to work with this integration and can be loaded into the Active Console without any additional work required.RTDS2.adb— Dashboard that is configured to work with this integration and can be loaded into the Active Console without any additional work required.RTDS Tools.adtREADME.txtRTDS1 Dashboard.jpeg
Installation Copied
Below are the steps to use the Gateway include files:
- Open up the Gateway Setup Editor.
- In the Gateway Setup Editor, right-click on the Includes folder and then select New Include.

- Change the Priority to any value other than
1. - In the Location field, enter the path of the include file that is in the binary package.
- Variables are pre-defined in the environments for each component. If you wish to change the variables, then go to Operating Environments > Var.
- If you are using
RTDS.xml, then you need to define the following variables:
- If you are using

| Variable | Definition | Default |
|---|---|---|
REFINITIV_BASE
|
Base directory of the RTDS installation. | /opt/refinitiv
|
LogPath
|
Full path to the log directory of your components. | /opt/refinitiv/log
|
RMDS_CONFIG
|
Subpath and the file name of your central config file. The value of this variable gets appended to the value of the REFINITV_BASE variable. |
/SOFTWARE/globalconfig/rmds.cfg
|
rifFilePath
|
Directory where the RMC interface files are located. |
Note: If not changed, the RMC interface files will be written in your Netprobe directory. |
Probes Copied
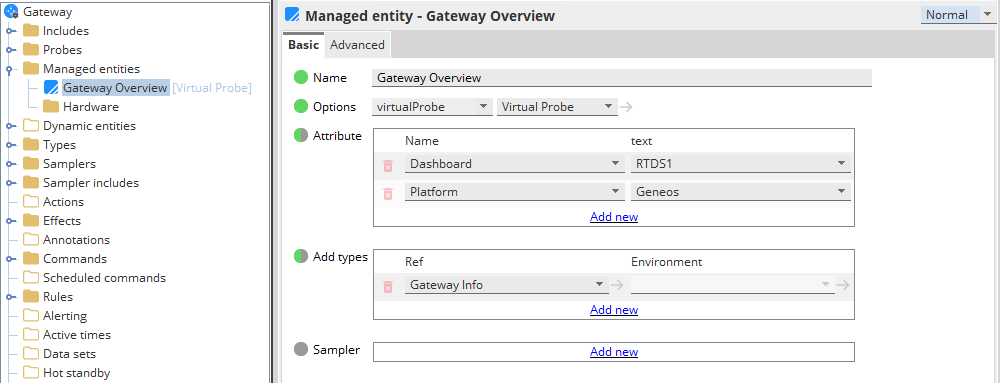
If you are using the GLOBAL_Geneos.xml, you will find a virtual probe in the Gateway Overview Managed Entity. This contains virtual self-monitoring for the Gateway with samplers for probes, client connections, data age, and many more.

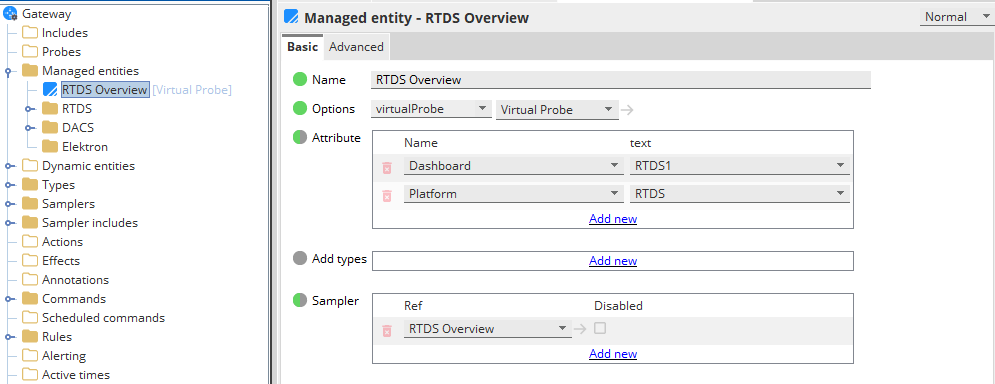
Similarly, you will also find a virtual probe in the RTDS Overview Managed Entity. The RTDS Overview Managed Entity assembles data for the dataview but also works very well as a platform overview in itself. All of these are driven by the pre-defined types, so even if you are not using the included Managed Entities, the dataviews should not be affected.

Types Copied
The GLOBAL_Geneos.xml and RTDS.xml include files have pre-defined types in the configuration.
Types in GLOBAL_Geneos.xml include file Copied

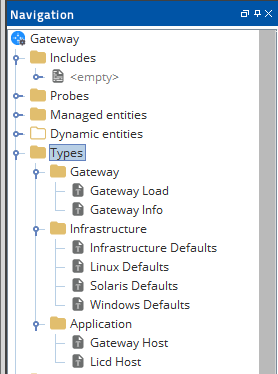
For hardware monitoring, all the types include process and logfile monitoring for a Netprobe,
The types in the Infrastructure folder cover the recommended baseline monitoring. The main type used is the Infrastructure Defaults which provides samplers for Disk, CPU, Network, and TOP plugins.
If you wish to monitor a Gateway host, then you must include the types in the Application folder as appropriate.
Types in RTDS.xml include file Copied

All types in the RTDS.xml include file contains standard samplers for Info, License, Processes, and Logfiles.
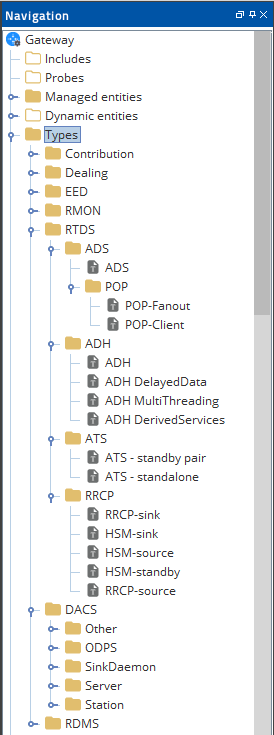
For application monitoring, the following types are typically in use:
ADH— covers the core functionality of a typical source distributor. This includes samplers for Routes, Servers, Services, TCP-Links, HotStandby, and secondary samplers to help with rules such as RoutesConfig that checks the configuration for the expected default state of all configured routes. TheADH DelayedData,ADH MultiThreading, andADH DerivedServicestypes can be appended to theADHtype for additional samplers.ADS— configured specifically for ADS with emphasis on Servers, Services, Mounts, Users, and DACS. The following types are also included in the ADS folder:POP-Fanout— for first-level POP servers with no enabled DACS, This contains all samplers for a standard ADS and Routes.POP-Client— for the client-facing POP servers so samplers for DACS monitoring are included in this type.
Note
For standard DACS application monitoring, you need to run a separate DacsTrans binary, which is included in the/bin/trandirectory.
For intrusive DACS monitoring, the Netprobe should run with the relevant Oracle or PostgreSQL client libraries loaded.
For all types in the ADH and ADS folders, there is a TCP-Links sampler monitoring for the ports 8101/14002 either remotely for ADH/POP or locally for ADS/POP.
For any standard ADH or ADS, you can add the RRCP-Sink and RRCP-Source types for monitoring the RRCP layer when running a standard RRCPD.
Note
For standard RRCPD application monitoring, you need to run a separateRrrcTransbinary, which is included in thedemodirectory.
If you are running a daemon less RRCP, then the HSM-Source, HSM-Sink, or HSM-Standby types are recommended. The statistics are in the shared memory of the main component and you do not need to run any Trans process.
For DACS application monitoring, you may use the types in the DACS > Station, DACS > Server, and DACS > SinkDaemon folders. The included types cover database monitoring for PostgreSQL or Oracle databases, and intrusive DACS monitoring. When doing map collects, these samplers will also provide an overview of any new PE sets before distribution.
Note
For standard DACS application monitoring, you need to run a separate DacsTrans binary, which is included in the
/bin/trandirectory.For intrusive DACS monitoring, the Netprobe should run with the relevant Oracle or PostgreSQLclient libraries loaded.
Commands Copied
You can interact with your RTDS through Geneos by using some of our built-in commands. Whilst these may be handy, we urge you to consider restricting use for a wider audience by using authentication.
For all samplers, the usual default Geneos commands are available as applicable. The following are some of the built-in commands included in the RTDS.xml include file:
- For ADH and POP, you can manually start and stop routes to restart servers and services by right-clicking on the Active column in the Routes dataview.
- You can dump or show the instrument list for each service by right-clicking on any cell in the ADH Services dataview.
- You can dump and subsequently show the UserDB by right-clicking on the Items headline in the ADS Users dataview.
- You can remove all users by right-clicking on the Users headline, or you can remove a user by right-clicking on any cell for any individual user in the ADS Users dataview.
- You can remove any individual mount by right-clicking on any cell for the mount in the ADS mounts dataview.
- You can retrieve any amount of lines into Geneos from an individual log by right-clicking on any cell and choosing ViewFile in all the dataviews for all LogFile samplers.
- You can start and stop a process by right-clicking on any process in all the Process dataviews.
Dataviews Copied
The include files contains many samplers, in return, there could be many dataviews that can be displayed in the Active Console. The following are some of the views that you can use:
-
The ADS and ADH dataviews show all sinks and sources are listed with the most urgent runtime statistics. In these views, there are also cells referencing the hardware severity of the application host.
Note
If you are not using theGLOBAL_Geneos.xmlfor your hardware monitoring and you set the following attribute<attribute name="Platform">Hardware</attribute>, then this should link to the dataview and the dashboard. -
The Info dataviews list all major components with runtime, server, license, version, and data dictionary version, if applicable. If any individual statistics are missing for a component type, then it is because the application provides no such information.
-
The RRCP dataview is also available if you have chosen to include RRCP monitoring, whether it is standard or daemon less. This dataview gives a quick overview of packet transfers, and any discard or retransmit between servers.
-
There are also dataviews showing all mounts and users on the entire platform. This enables you to find and filter any user or mount without having to jump from server to server.
-
There is also a dataview listing any problematic mounts in terms of requested stale and non-recoverable closures.
-
There is also a dataview dedicated to services that shows all services across the platform on the individual sink and source levels, and a summarised version for the platform as a whole.
Dashboards Copied
The downloaded binary package includes the following Active Dashboard files: RTDS1.adb and RTDS2.adb.
If you are using the RTDS.xml include file, then the Dashboard attribute is set as <attribute name="Dashboard">RTDS1</attribute>, and the data from your Gateway will be displayed in the RTDS1.adb Active Dashboard.
If you are using a second Gateway, then set the Dashboard attribute as <attribute name="Dashboard">RTDS2</attribute>, which will display the data from your second Gateway in the RTDS2.adb Active Dashboard.
The following is an example that shows what the Active Dashboard looks like:
