Opsview 6.8.x End of Support
With the release of Opsview 6.11.0 on February 2025, versions 6.8.x have reached their End of Support (EOS) status, according to our Support policy. This means that versions 6.8.x will no longer receive code fixes or security updates.
The documentation for version 6.8.9 and earlier versions will remain accessible for the time being, but it will no longer be updated or receive backports. We strongly recommend upgrading to the latest version of Opsview to ensure continued support and access to the latest features and security enhancements.
Problems
Overview Copied
This page allows you to see, on a single screen all the problems that Opsview Monitor has detected.
Go to the Configuration > Problems menu:
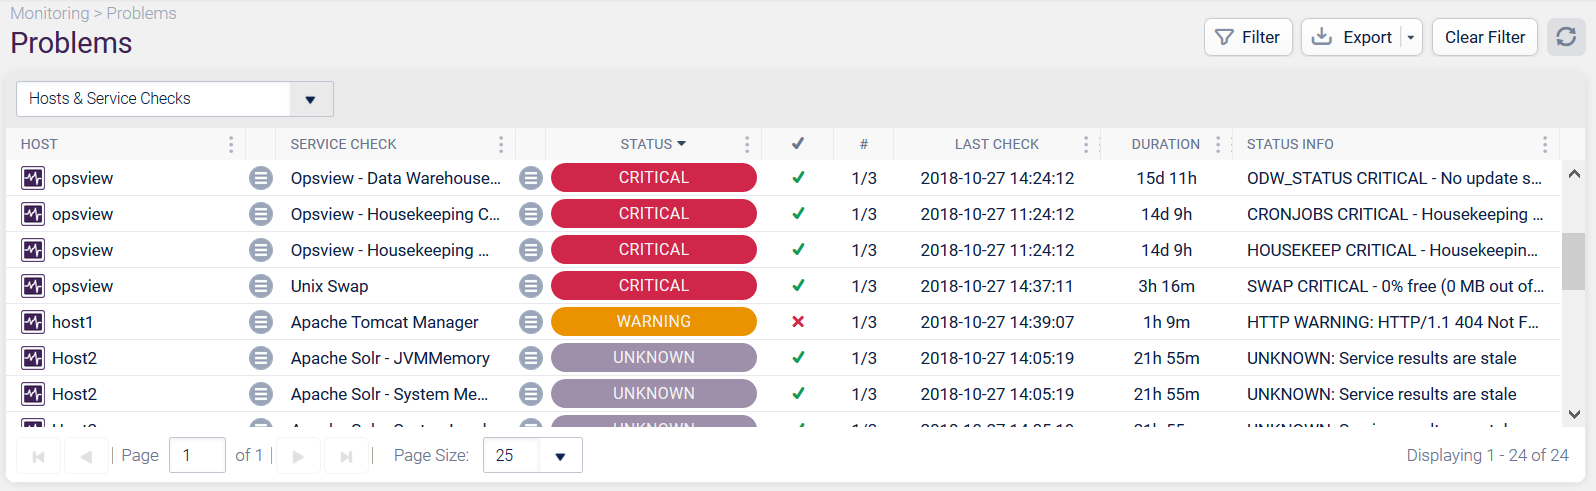
Once loaded, the page will display all Service Checks and Host Checks that are currently in a non-OK state (CRITICAL, WARNING, or UNKNOWN, and DOWN or UNREACHABLE):
These are the columns within the table:
- Host — name of the Host which has failed, or has a Service Check that has failed.
- Service Check — if this is a problem with a Host, nothing will be listed here. If not, then the name of the Service Check will be listed here.
- Status — status of the Service Check or Host problem. For example, if the host is down, this will display a
CRITICALlabel. - ✔️ Handled? — whether this problem is handled (
✓tick) or unhandled (✗cross). - Number (#) — for a soft state problem, the current number of rechecks that have occurred out of the maximum. For example, if the max check attempts is 3 and it has been re-checked twice, this will display
2/3. For a hard state problem, this will display 1 out of the maximum,1/3. - Last Check — timestamp of the last check carried out for this problem.
- Duration — length of time this problem has had the current status.
- Status Info — status string returned from the Host or Service Check. The Status Info column will truncate any data that is too long and add replace it with ellipses. If you click on the cell, more information will be revealed. After a refresh of data, the cell will go back to truncated mode.
There is also an Expand All Rows option in the grid header menu:
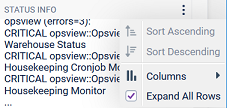
If this is checked, then all the rows will be expanded. This option will persist when a refresh of data occurs and also when saving or sharing a link.
Similar functionality is available on all grids that display this status information: Checker, Event Graph Dashlet, Top Service Issues Dashlet, Event Viewer, Hashtag Detail, All Notifications, Mass Action windows.
Additional columns that can be enabled from the columns option in the grid header menus are:
- Host Group — name of the Host Group for the Host.
- Network Address — network address of the Host.
- Host Description — description of the Host.
- Host Notes — if there are any notes attached to this Host, an icon will be displayed here. Click the icon to bring up a modal allowing you to edit the note.
- Host Downtime — if this Host is undergoing a scheduled downtime, an icon will be displayed here.
- Service Graphs — for Service Checks, this will display a graph icon if the Service Check returns performance data. Click the icon to bring up the Investigate modal in graph view.
- Service Notes — if this is a Service Check with attached notes, an icon will be displayed here. Click the icon to bring up a modal allowing you to edit the note.
- Service Downtime — if this is a Service Check, and is undergoing a scheduled downtime, an icon will be displayed here.
- State Type — state type of this problem, will display either
SoftorHard.
You can click on the contextual menu next to a Host or Service Check and undertake a range of actions, as you would if you were clicking on the contextual menu of the Service Check within the Hashtags/Navigator pages.
Filtering Copied
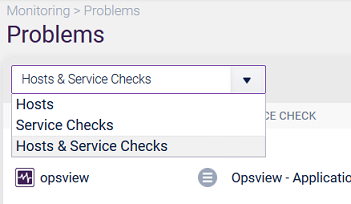
By default, the Problems page will show all Hosts and all Service Checks, but you can filter to show only one type by changing the menu:
You can also filter by different object types or states by using the Filter button.
For instance, you can do complex filtering such as:
- Show me problems in the “US - Boston” Host Group that are unhandled.
- Show me problems with Unix Load Average for all the production Hashtags.
- Show me problems that are CRITICAL where the Host name starts with
qa.
Note
Filter criteria is only applied ‘after’ clicking the Apply Filter button.
Exporting Copied
The Problems data can be exported using the Export button, into one of three formats:
- .csv
- .json
- .xml
To export the data, simply click on the Export button and then choose the desired format.
This will take the data within the Problems section and export it to the chosen format, which will be downloaded via your browser.
Sharing Copied
The Problems page can also be shared with other users of Opsview Monitor. This allows you to filter the Problems section using the aforementioned filters and then send your team members a link which, when clicked, will take them to the exact same page.
To share your specific, customized view, simply click on the ‘Share’ arrow, located within the navigation bar.
When clicked, this button will display a modal window which contains a hyperlink:
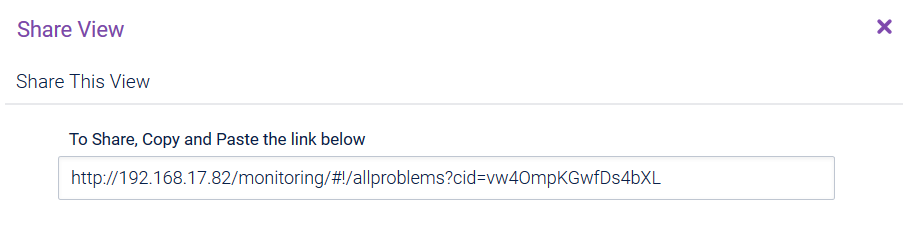
This hyperlink can be shared with other Users of Opsview Monitor, who when navigating to this link, will see the exact same view including filters, time period and more.
Example filters you may want to create include:
- Unhandled problems (All)
- Only CRITICAL problems, Unhandled
These filters can then be displayed on display boards throughout the office, meaning if any new problem happens then it will be displayed prominently within the filtered Problems section.