Opsview 6.8.x End of Support
With the release of Opsview 6.11.0 on February 2025, versions 6.8.x have reached their End of Support (EOS) status, according to our Support policy. This means that versions 6.8.x will no longer receive code fixes or security updates.
The documentation for version 6.8.9 and earlier versions will remain accessible for the time being, but it will no longer be updated or receive backports. We strongly recommend upgrading to the latest version of Opsview to ensure continued support and access to the latest features and security enhancements.
Troubleshooting
This page describes how to investigate Opsview Monitor problems.
Opsview Components Copied
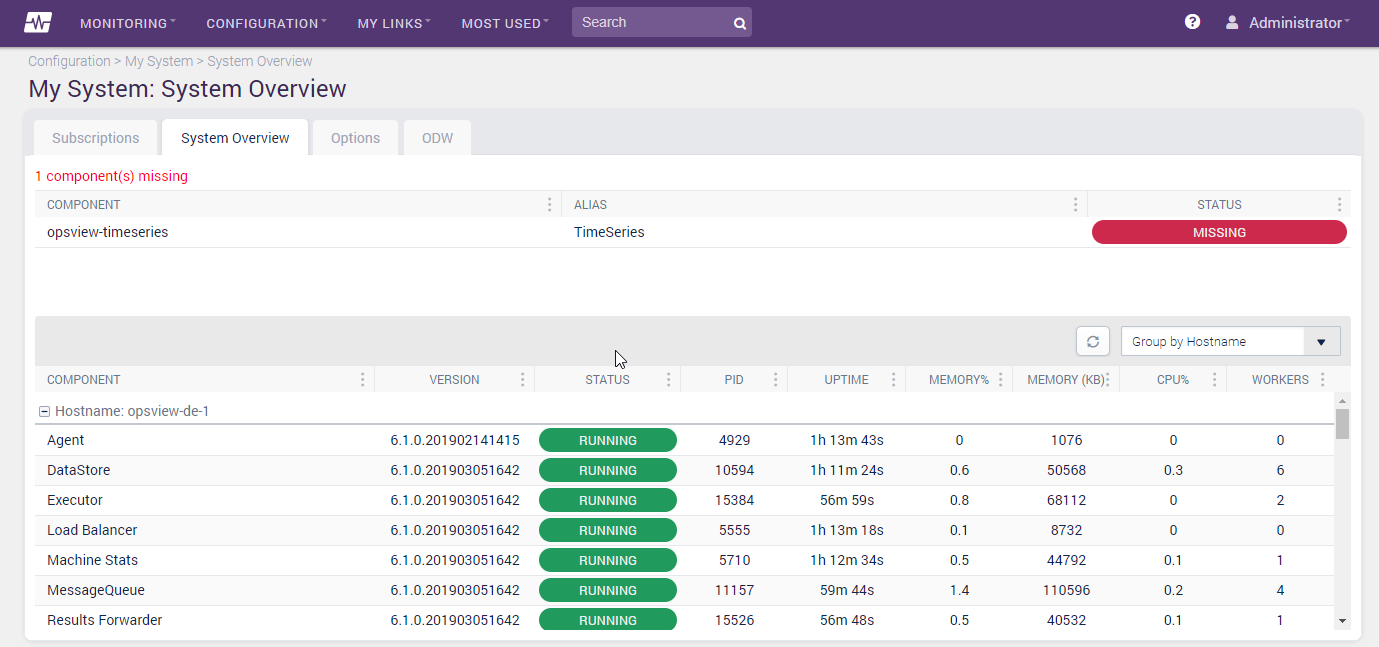
The first place you should go to when you are encountering issues with Opsview Monitor is the Configuration > My System > System Overview tab. If there are problems with a component, or some missing components, this page will highlight them.
Diagnostics Copied
On the Monitoring Engine tab there is also a button labeled Download Now, which will download a .tar.gz file with all the relevant syslogs, and others:
This diagnostic information will be useful when you raise issues with our support team.
Web user interface is not working Copied
If the web interface is the problem then you will not be able to access these web pages. If this is the case, run the command /opt/opsview/watchdog/bin/opsview-monit summary as the root user, as seen below:
# /opt/opsview/watchdog/bin/opsview-monit summary
Monit 5.24.0 uptime: 4d 5h 34m
┌─────────────────────────────────┬────────────────────────────┬───────────────┐
│ Service Name                    │ Status                     │ Type          │
├─────────────────────────────────┼────────────────────────────┼───────────────┤
│ tvoon-centos7-test              │ OK                         │ System        │
├─────────────────────────────────┼────────────────────────────┼───────────────┤
│ opsview-watchdog                │ Running                    │ Process       │
├─────────────────────────────────┼────────────────────────────┼───────────────┤
│ opsview-web                     │ Running                    │ Process       │
├─────────────────────────────────┼────────────────────────────┼───────────────┤
│ opsview-timeseriesrrdupdates    │ Running                    │ Process       │
├─────────────────────────────────┼────────────────────────────┼───────────────┤
│ opsview-timeseriesrrdqueries    │ Running                    │ Process       │
├─────────────────────────────────┼────────────────────────────┼───────────────┤
│ opsview-timeseriesenqueuer      │ Running                    │ Process       │
├─────────────────────────────────┼────────────────────────────┼───────────────┤
[snipped]
If you have any issues with the processes above, for example, opsview-web, then you can restart an individual process with the command:
# /opt/opsview/watchdog/bin/opsview-monit restart opsview-web
You should also check to make sure your database is up, running and accessible.
You can also view detailed information about each process by running the following command as the root user:
# /opt/opsview/watchdog/bin/opsview-monit status opsview-web
The Monit daemon 5.14 uptime: 4d 6h 54m
Process 'opsview-web'  status                            Running
monitoring status                 Monitored
pid                               3451
parent pid                        1
uid                               999
effective uid                     999
gid                               998
uptime                            3h 21m
children                          3
memory                            250.8 MB
memory total                      1.0 GB
memory percent                    5.0%
memory percent total              20.7%
cpu percent                       0.0%
cpu percent total                 0.0%
data collected                    Tue, 15 Sep 2015 16:16:39
If you encounter the error:
# /opt/opsview/watchdog/bin/opsview-monit summary
Monit: the monit daemon is not running
Then the opsview-watchdog service is not running. To start it, as root, run the commands:
# pkill -u opsview
# systemctl start opsview-watchdog
# /opt/opsview/watchdog/bin/opsview-monit start all
This will kill any leftover processes, start the daemon, and then restart all the services which the watchdog is controlling.
If the watchdog process starts but the processes it is monitoring do not, check your sudo configuration (using the command visudo) does not have Defaults requiretty enabled. If it does, disable it (by commenting it out with a ‘#’ character) and rerun the following:
# /opt/opsview/watchdog/bin/opsview-monit validate
Finally, if your watchdog services start (as per the ‘summary’ command), but suddenly shutdown after a minute, you may not have enough free disk space. Opsview Monitor requires a MINIMUM of 2GB free space. If this threshold is breached, Opsview Monitor will elegantly shutdown instead of crashing and leaving the system in a problematic state when the disk space issue is resolved.
To confirm you are encountering the disk space issue, run the command:
# cat /var/log/syslog | grep "resource limit"
Sep 15 12:06:47 ov-author opsview-monit[4362]: 'rootfs' space free 1.7 GB matches resource limit [space free>2.0 GB]
Sep 15 12:06:47 ov-author opsview-monit[4362]: 'varfs' space free 1.7 GB matches resource limit [space free>2.0 GB]
Sep 15 12:06:47 ov-author opsview-monit[4362]: 'optfs' space free 1.7 GB matches resource limit [space free>2.0 GB]
If you see these errors, you should check your free disk space using df:
# df -h
Filesystem                     Size  Used Avail Use% Mounted on
/dev/mapper/ovauthorvg-rootlv  9.3G  7.6G  1.2G  87% /
none                           4.0K     0  4.0K   0% /sys/fs/cgroup
udev                           2.5G  4.0K  2.5G   1% /dev
tmpfs                          497M  352K  496M   1% /run
none                           5.0M     0  5.0M   0% /run/lock
none                           2.5G     0  2.5G   0% /run/shm
none                           100M     0  100M   0% /run/user
/dev/mapper/ovauthorvg-bootlv  233M   38M  179M  18% /boot
Logs Copied
Logs are always a good place to start when it comes to troubleshooting. See the Logging section for information about how logs are generated.
Databases Copied
We have seen issues where a database has a bad schema and indexes are given the wrong name. This causes problems for the upgrade scripts as they expect specific names to exist when upgrading.
Follow this process to reset the schema while retaining the existing data. You should not normally have to do this.
- Stop all Opsview Components
- Take a backup of the opsview database:
/opt/opsview/coreutils/bin/db_opsview db_backup > /tmp/opsview.db - Take another backup, for comparing differences:
mysqldump -u {user} -p{password} --default-character-set=utf8mb4 --skip-extended-insert opsview | sed 's/character_set_client = utf8 /character_set_client = utf8mb4 /' > /tmp/opsview.diff - Export just data from the database:
mysqldump --default-character-set=utf8mb4 --skip-extended-insert -t -c -u {user} -p{password} opsview | sed 's/character_set_client = utf8 /character_set_client = utf8mb4 /' > /tmp/opsview.data - Create the database from scratch:
/opt/opsview/coreutils/bin/db_opsview db_install - Export the schema information from a fresh install:
mysqldump -d -u {user} -p{password} --default-character-set=utf8mb4 opsview | sed 's/character_set_client = utf8 /character_set_client = utf8mb4 /' > /tmp/opsview.schema - Delete and recreate just the database:
echo 'drop database opsview; create database opsview' | mysql -u {user} -p{password} - Import the fresh schema information:
mysql -u {user} -p{password} opsview < /tmp/opsview.schema - Import the data:
mysql -u {user} -p{password} opsview < /tmp/opsview.data - Take a new backup:
/opt/opsview/coreutils/bin/db_opsview db_backup > /tmp/opsview_post.db - Take another backup, for comparing:
mysqldump -u {user} -p{password} --default-character-set=utf8mb4 --skip-extended-insert opsview | sed 's/character_set_client = utf8 /character_set_client = utf8mb4 /' > /tmp/opsview2.diff - Compare to check differences:
diff -u /tmp/opsview.diff /tmp/opsview2.diff - Start all Opsview Components.
CentOS/RHEL — Automatic dependencies Copied
yum should automatically resolve all dependencies when installing Opsview Monitor. However, in some instances during installation, if the Opsview Monitor packages don’t include opsview-base, opsview-perl and so on, then ensure yum-updatesd-helper is not running and execute the following commands:
# yum remove opsview
# yum clean all
# yum makecache
Finally, running the command shown below should show the correct dependencies and allow Opsview Monitor to install correctly:
# yum deplist opsview
# yum install opsview
Access denied for some files within the repositories Copied
If you replicate our public repository to a server on your own network, you may find you get Access Denied errors when trying to copy some files.
This is expected behavior as some files within the repository are restricted to customers that purchase additional modules.