Opsview 6.8.x End of Support
With the release of Opsview 6.11.0 on February 2025, versions 6.8.x have reached their End of Support (EOS) status, according to our Support policy. This means that versions 6.8.x will no longer receive code fixes or security updates.
The documentation for version 6.8.9 and earlier versions will remain accessible for the time being, but it will no longer be updated or receive backports. We strongly recommend upgrading to the latest version of Opsview to ensure continued support and access to the latest features and security enhancements.
Configuring Flow Collectors
Configuring devices Copied
Network devices that support one of the three protocols can be configured to send data to Opsview Monitor, so that it can be stored, analyzed and displayed. The configuration of each protocol varies from vendor to vendor, however on a Cisco router the main part of the required configuration is:
ip flow-export source Ethernet0/0 ip flow-export destination 192.168.11.11 9997
You then have to configure ‘ip flow ingress’ on each router sub interface you wish to monitor the traffic of. To view the configuration of the Cisco router, run the command ‘show ip flow export’, as shown below:
2611#show ip flow export
Flow export v1 is enabled for main cache
Exporting flows to 192.168.11.11 (9997) 192.168.15.23 (9997)
Exporting using source interface Ethernet0/0
Version 1 flow records
Cache for destination-prefix aggregation:
Flow export is disabled
35687335 flows exported in 4525686 udp datagrams
0 flows failed due to lack of export packet
4525685 export packets were sent up to process level
0 export packets were dropped due to no fib
0 export packets were dropped due to adjacency issues
0 export packets were dropped due to fragmentation failures
0 export packets were dropped due to encapsulation fixup failures
For more information on configuring Cisco devices to export NetFlow data, please use online internet results to review this information. For information on configuring NetFlow/jFlow/sFlow for your network device, please contact your network device vendor.
As you will notice, we have configured the router to send flow data to a specific destination. This destination must be either the Opsview Monitor master or a collector in an Opsview cluster, which is known as a Flow collector, i.e. something that collects inbound flow packets and stores them. The device sending the flow data is known as a source, i.e. the source of the data.
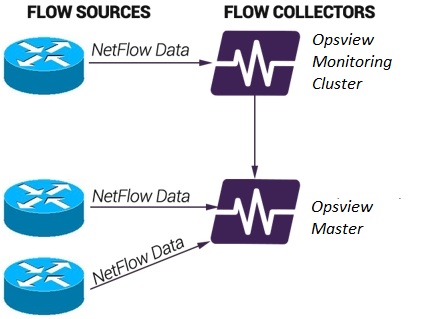
In the example above, you can see that we have three routers that are exporting flow data; one is sending flow data to a flow collector server in an Opsview Cluster, and the remaining two are sending flow data to the master. The routers are labelled ‘flow sources’, and the Opsview Monitor servers are ‘flow collectors’.
Note
You may need to open ports through your firewall to allow the network devices to pass data to Opsview Monitor. Check your device configuration on which ports to open.
Adding a Flow Collector Copied
To add a Flow Collector, navigate to the Configuration > Flow Collectors page.
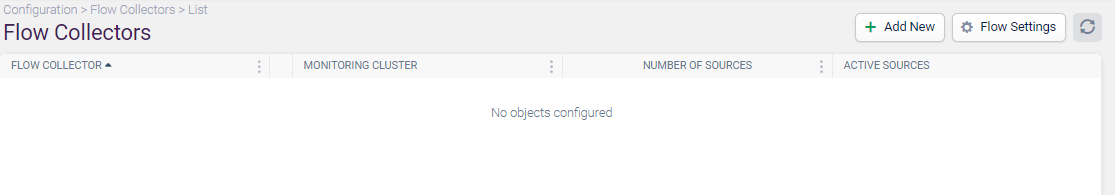
To add a new Flow Collector, click on the Add New button in the top left. This will load a modal window as shown below:
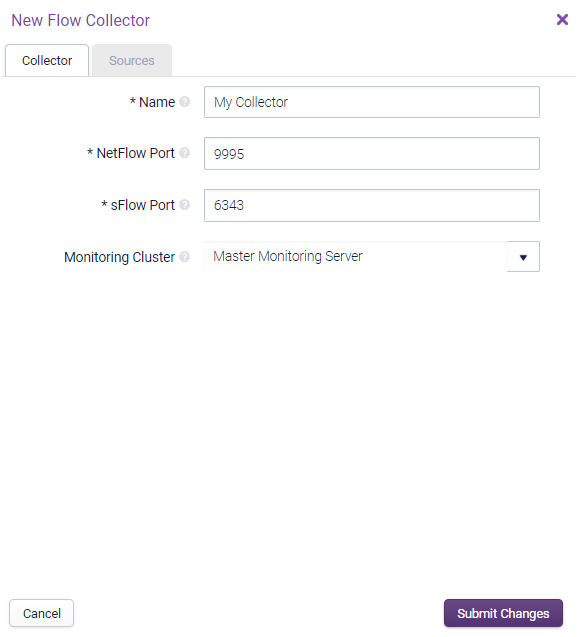
The modal window contains the following fields:
Name Copied
The name of the Flow Collector, i.e. ‘Master’, ‘UK’, etc.
NetFlow port Copied
The port to which NetFlow data should be sent to; this can be modified. This port is set by the user and please ensure that the network connectivity is open as this will stop the netflow results from being received if it is not
Note
When manually changing the port to an already configured Flow Collector, it is required to run “Apply Changes” (from the Configuration menu) and restart opsview-flowcollector on the Opsview collector.
sFlow port Copied
The port to which sFlow data (and also jFlow) data should be sent to. This is also user-modifiable.
Monitoring cluster Copied
Choose the monitoring cluster that will act as the newly configured Flow Collector. This cannot be edited once saved.
A monitoring cluster can only be configured as a Flow Collector once, i.e. if you have one cluster and the master monitoring cluster, you can have a maximum of two Flow Collectors.
Adding a source Copied
Now that you have added your Flow Collectors, you can configure the Flow Sources; a Flow Source being a Host that is sending Flow data inbound into a flow collector.
To add a Flow Source, edit a collector and navigate to the Sources tab and click on the Add New button:
In the example above, we have added our Flow Source, ‘Cisco2611’, and its IP address has been determined via lookup. If the IP address cannot be looked up, then the field will display an error as shown below:
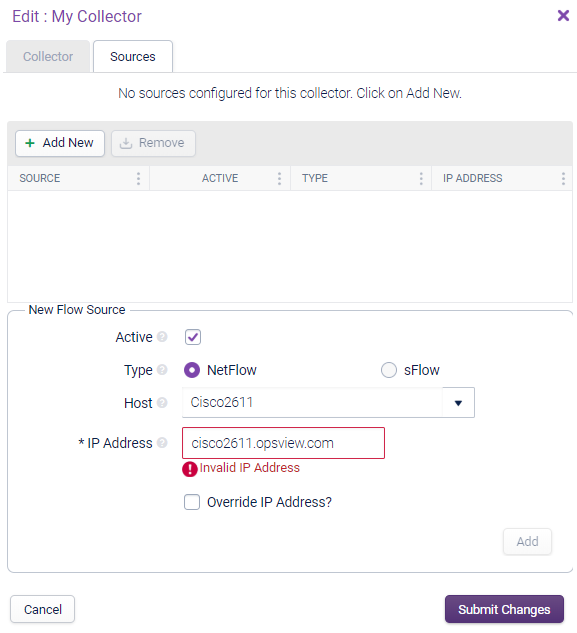
This error is displayed as Opsview Monitor needs to know the IP address of the Host in order to map the received Flow data (which contains a ‘From:’ field containing an IP address) to the Host, i.e. ‘cisco2611.opsview.com == 192.168.13.2’. To add the IP, click on ‘Override IP Address?’ and manually enter the IP address.
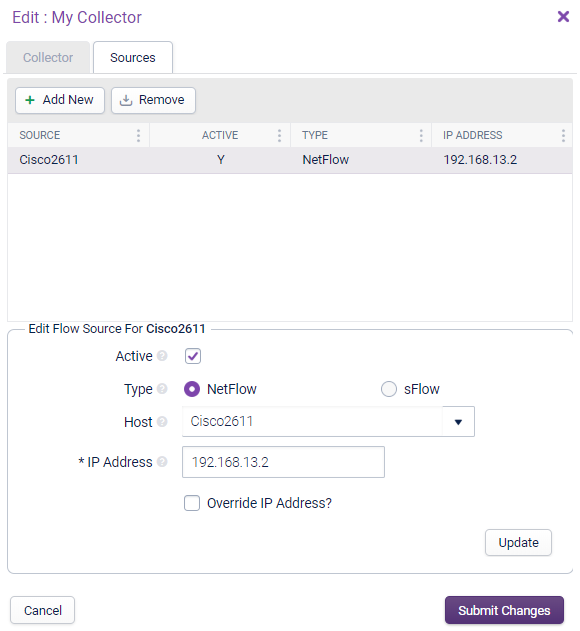
Once the correct Host and IP address has been entered, ensure you have selected ‘Active’ ’ otherwise the Flow Source wont be displayed within the Flow Collector Dashlets.
Click ‘update’ to save any changes you have made to the individual Flow Source, and then finally click ‘Submit Changes’ to close the window and save the newly added Flow Sources.
It is then required to apply your changes for both the Flow Collector and the newly-added Flow Sources, by running Configuration - Apply Changes from the navigation bar.
Note
Before you remove the Flow Collector feature, please delete any Flow Collector sources and Flow Collectors, otherwise you will not be able to edit some information on the host or cluster.
Field details Copied
Active Copied
To easily enable or disable this Flow Source.
Type Copied
Choose the type of Flow Source. For JFlow, use the sFlow option.
Host Copied
Choose the Host that is the Flow Source. You can only choose Hosts that are associated to this Monitoring Cluster for this Flow Collector.
IP Address Copied
This is the IPv4 address of the Flow Source which will send data to the Flow Collector. Opsview will name resolve this for you if possible. Use the IP Override checkbox if you need to set a specific address.
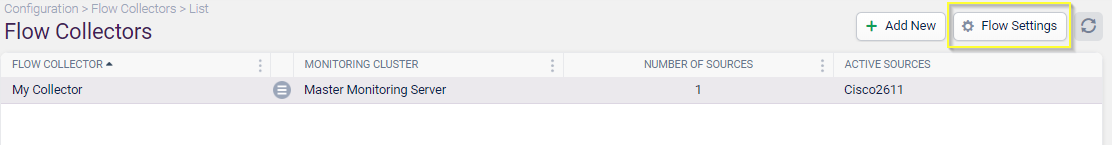
Configuration options Copied
Within the ‘Flow Collector’ configuration page, there is a ‘gear cog’ icon which loads the global settings for the Flow Collector module:
Clicking on this ‘Settings gear cog’ icon will load a modal window as shown below:
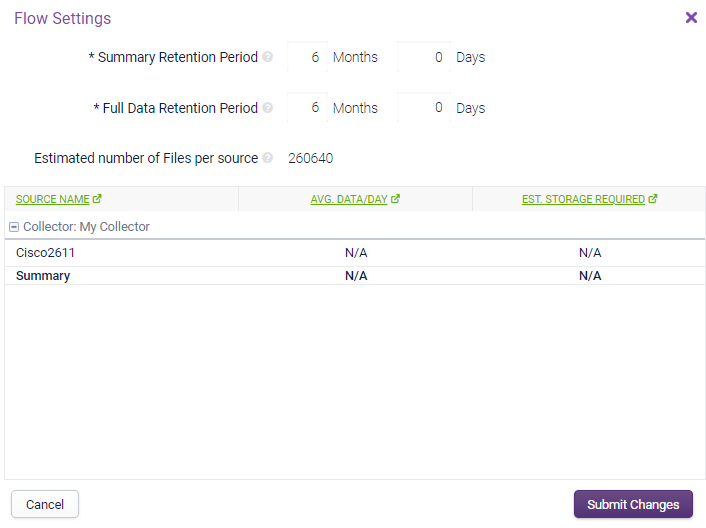
This window allows you to change the retention period of data received from Flow Sources, along with an indicator showing the average data per day used per Flow Source, and the estimated storage required based on the values entered.
Summary Retention Period Copied
How long the Opsview Monitor system should retain summary data, i.e. rounded up, summarised values as opposed to the per second/minute data files initially received. This data is stored within the ‘opsview_netflow_stats’ table in the Runtime database on the Opsview Monitor master server.
Full Data Retention Period Copied
How long the Opsview Monitor system should retain the ‘raw’ data, i.e. the files within /opt/opsview/flowcollector/var/data that contain the per second/minute data.
Estimated Number of Files Per Source Copied
This is an estimate of the number of files required based on the retention periods defined. As there could be a large number of files, ensure the filesystem will allow this amount of files to be created.
Source Name Copied
This column shows each source and its estimated requirements.
Average Data per Day Copied
The Average data/day is based on data over the last week. If there is less than a week’s worth of data, the actual duration of data will be displayed in parenthesis, eg (three hours), so that you have an idea of how representative the value will be.
Estimated Storage Required Copied
This is an estimate of the amount of space required. Ensure the Flow Collector has this amount of space available.
Resync the NetFlow information Copied
You may find an error returned of “An error occurred while fetching data” and this may be that the order of how the Netflow data is being retrieved from the collector cluster has changed.
- to resolve this, remove the newer collector from the cluster (via Monitoring Collectors), Apply Changes and then re-add it, followed by a further Apply Changes
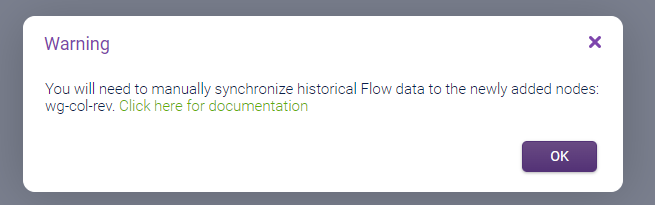
- in the interim you will receive the message of “You will need to manually synchronize historical Flow data to the newly added nodes.”