Opsview 6.8.x End of Support
With the release of Opsview 6.11.0 on February 2025, versions 6.8.x have reached their End of Support (EOS) status, according to our Support policy. This means that versions 6.8.x will no longer receive code fixes or security updates.
The documentation for version 6.8.9 and earlier versions will remain accessible for the time being, but it will no longer be updated or receive backports. We strongly recommend upgrading to the latest version of Opsview to ensure continued support and access to the latest features and security enhancements.
Creating and Saving a Graph View
You can create a variety of Graph Views within Monitoring > Graph Center that allows you to check and analyze the health of your infrastructure from different perspectives.
Creating a Graph View Copied
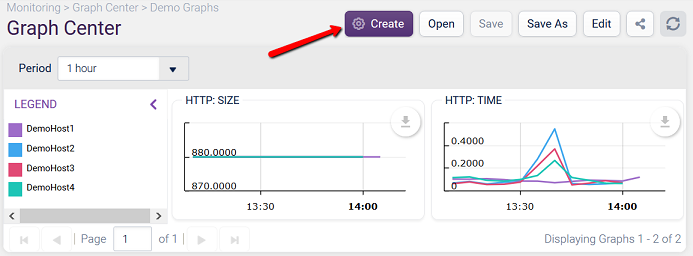
To create a new view click on the Create button:
Once clicked, a new configuration window is displayed:
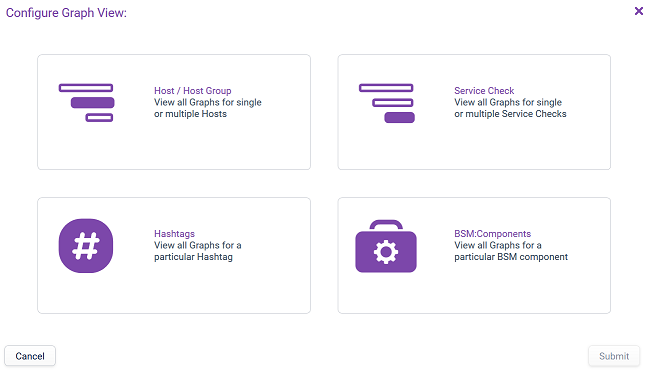
This window offers to create graph views in one of four ways:
- Host/Host Group: Create a new graph view based on one host or all or a set of hosts in a host group.
- Service Check: Create a new graph view based on a Host Template or an individual Service Check, e.g. show me a graph view with all the graphs from Host Template A - plotting all hosts using Host Template A on the graphs, OR, show me all the Hosts using ‘Service Check A’ (e.g. compare all hosts using ‘Unix Load Average’, for example).
- Hashtags: Create a new graph view based on a specific Hashtag; e.g. show me all Service Checks tagged with #hashtag, in a graphical format.
- BSM:Components: Create a new graph view based on a specific component (BSM); e.g. show me all service checks that are within the component ‘Linux Cluster X’.
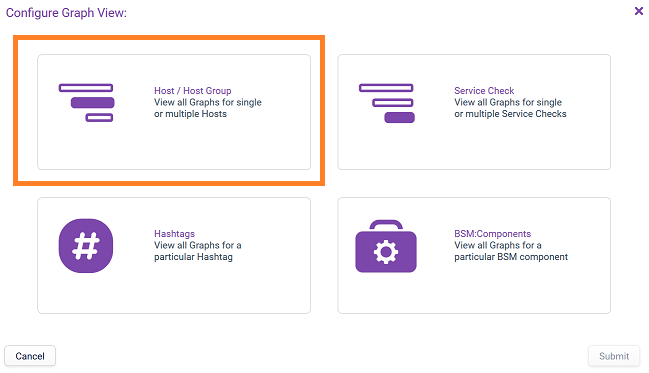
To create a new graph view, click anywhere on the menu ’tile’.
Host/Host Group View Copied
Click on the Create button and then click on Host/Host Group:
Once clicked, the following window is displayed:
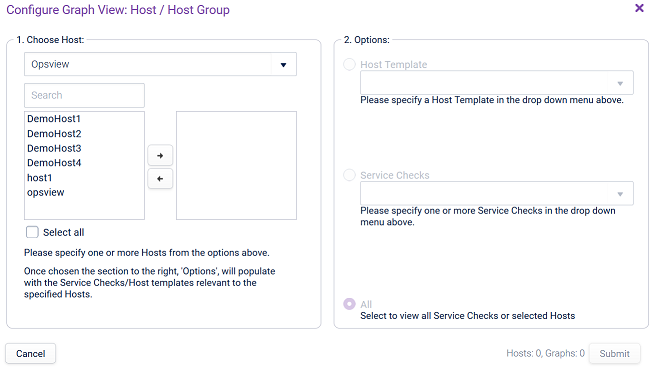
First, you must choose the Hosts on which you wish to base your graph view. To do this, select a Host Group and then select the Hosts in the left selection box and click the ‘right’ arrow to add them into the right selection box, as shown below:
Note
You can add Hosts from different Host Groups.
Then refine the data you want to display by using the Options. The dropdown boxes will repopulate with Service Checks / Host Templates that only apply to the selected Hosts.
Note
If a Service Check is not applied to all of the selected Hosts, it will still be displayed, however the graph for that Service Check will only display the Hosts who have the Service Check applied.
Click Submit and your new Graph View is displayed.
Hashtags View Copied
Click on the Create button and then click on Hashtags.
Once clicked, the following window is displayed:
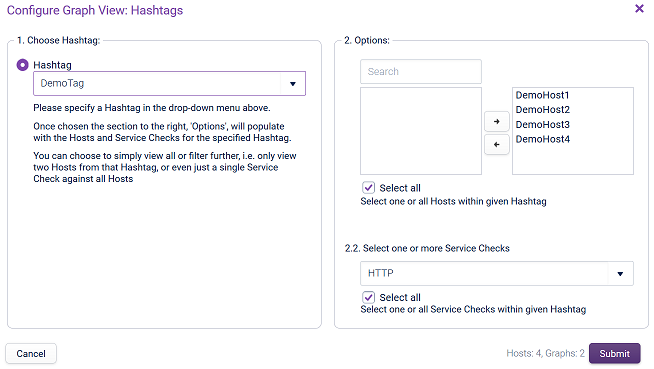
From the dropdown on the left, choose the Hashtag for which you wish to view the graphs:
Note
Only hashtags with ‘metrics’ will be listed.
Then refine the data you want to display by using the Options section. The dropdown boxes will repopulate with the Hosts and Service Checks tagged with the chosen Hashtag.
Click Submit and your new Graph View is displayed.
Service Check View Copied
Click on the Create button and then click on Service Check.
Once clicked, the following window is displayed:
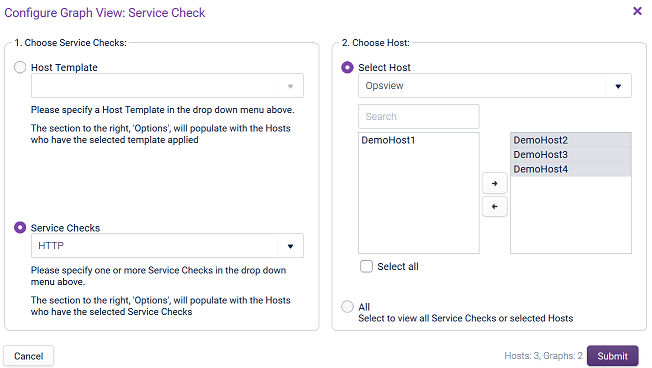
The first section allows you to choose either:
- a Host Template
- or one or more Service Checks.
Then refine the data you want to display by using the Options section. The dropdown boxes will repopulate with the Hosts which have the selected Host Template/Service Checks.
By default, the ‘All’ radio button is selected but you can also use the ‘Select Host’ radio button to choose one or more individual Hosts.
Click Submit and your new Graph View is displayed.
BSM:Component View Copied
Click on the Create button and then click on BSM:Components:
Once clicked, the following window is displayed:
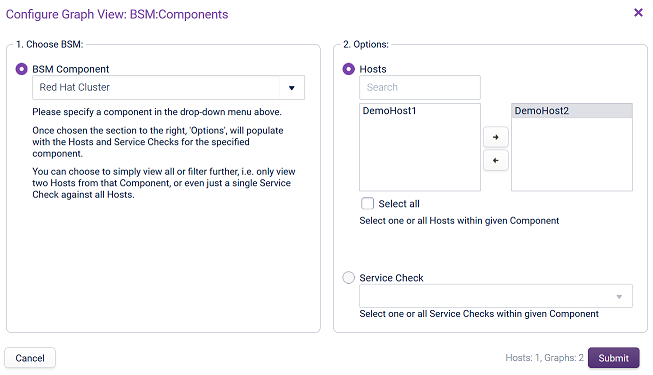
First choose the Component for which you wish to view the graphs.
Then refine the data you want to display by using the ‘Options’ section. The dropdown boxes will repopulate with the hosts and Service Check data.
You can either select to filter by Hosts by selecting the Hosts within the component that you wish to view the graphs of, either individually or ‘all’ (via the ‘Select all’ checkbox):
By choosing ‘Hosts’, all Service Checks on the selected Hosts will be graphed.
If you wish to graph only a sub-section of the service checks within the Component, select ‘Service Check’ and select the Service Checks you wish to graph. This allows filtering by Service Check, but will display all Hosts that have that Service Check selected.
Finally, click Submit and the Graph View will be created.
Saving a Graph View Copied
There are two buttons available in the top-right area: Save and Save As that allows you to save new views or simply save edits that you have made to an existing view.
Saving a new view Copied
Once you have created your first graph view, you may want to save it so that you can easily be loaded it in the future. To save, click on the Save As.
Give the Graph View a meaningful name and if needed more description and click Save.
This view is then available for you to open at any point, as explained in Modify Graphs.
Saving an edited view Copied
If you have amended an existing graph using the ‘Edit’ button (as per Modify Graphs ), you can then chose to:
- Save: this updates the initial view you made the edits from.
- Save As: this create a brand new view whilst preserving the initial view you made the edits from. This is also an easy way to create multiple views without having to start from scratch.