Opsview 6.8.x End of Support
With the release of Opsview 6.11.0 on February 2025, versions 6.8.x have reached their End of Support (EOS) status, according to our Support policy. This means that versions 6.8.x will no longer receive code fixes or security updates.
The documentation for version 6.8.9 and earlier versions will remain accessible for the time being, but it will no longer be updated or receive backports. We strongly recommend upgrading to the latest version of Opsview to ensure continued support and access to the latest features and security enhancements.
Timeseries Graphing Engine
The Opsview Monitor Timeseries graphing data engine provides a very flexible service for storing data used by the graphing services in the UI. In the default configuration, all data is stored on the master server. However, if you experience high IO or load on the master server, then the graphing data engine may be moved onto another server.
Installation Copied
The graphing data engine is provided in 4 packages that are installed by default on the Orchestrator via Opsview Deploy.
opsview-timeseries— request dispatcher.opsview-timeseries-enqueuer— request queuing and caching daemon.opsview-timeseries-lib— shared libraries between the other timeseries packages.opsview-timeseries-rrd— provides the RRD based data storage.
All of these packages are installed under /opt/opsview and the directory names match the package names:
- timeseries
- timeseriesenqueuer
- timeserieslib
- timeseriesrrd
Each package uses the same directory structure and they all log to syslog (usually into log files within /var/log, depending on how your system is configured).
Processes Copied
All of the timeseries processes are stopped and started using the Opsview Monitor Watchdog. You can check them by running the following as the opsview user:
$ opsview_watchdog summary
+----------------------------------------+------------+-------------------+
| Service                                | Status     | Monitoring Status |
+----------------------------------------+------------+-------------------+
.... cut ....
| Process 'opsview-timeseriesrrdupdates' | Running    | Monitored         |
| Process 'opsview-timeseriesrrdqueries' | Running    | Monitored         |
| Process 'opsview-timeseriesenqueuer'   | Running    | Monitored         |
| Process 'opsview-timeseries'           | Running    | Monitored         |
The processes can be stopped, started and restarted individually, if required, for example:
$ opsview_watchdog opsview-timeseries restart
Configuration Copied
All configuration should be done using Opsview Deploy; no changes should be made manually to any timeseries configuration file.
Moving RRD Timeseries to another server Copied
There are a number of steps involved in moving Timeseries to another server.
The first step is to add the correct configuration into the Deploy opsview_deploy.yml file, such as
timeseries_hosts:
  opsview-uk-timeseries-1:
    ip: 10.2.14.91
and then run a deploy as root to install the packages on the new timeseries server:
cd /opt/opsview/deploy
bin/opsview-deploy lib/playbooks/timeseries-install.yml
At this point you should shut down the performance data component and all of the timeseries daemons on both the existing server and the new server:
On the existing server as root:
/opt/opsview/watchdog/bin/opsview-monit stop opsview-resultsperformance
/opt/opsview/watchdog/bin/opsview-monit stop opsview-timeseries
/opt/opsview/watchdog/bin/opsview-monit stop opsview-timeseriesrrdupdates
/opt/opsview/watchdog/bin/opsview-monit stop opsview-timeseriesrrdqueries
On the new server as root:
/opt/opsview/watchdog/bin/opsview-monit stop opsview-timeseries
/opt/opsview/watchdog/bin/opsview-monit stop opsview-timeseriesrrdupdates
/opt/opsview/watchdog/bin/opsview-monit stop opsview-timeseriesrrdqueries
You must transfer all the data files from the existing timeseries server to the new timeseries server using rsync (or similar), otherwise all graphing history will be lost. By default, Timeseries RRD uses the /opt/opsview/timeseriesrrd/var/data directory.
After transferring, run deploy to reconfigure opsview:
cd /opt/opsview/deploy
bin/opsview-deploy lib/playbooks/setup_opsview.yml
This will restart all the daemons on the new timeseries server as well as reconfigure the UI. At this point, graphing data should now be provided from the new Timeseries server and reloads should work successfully.
After you have tested the graphs and reloads you can remove the timeseries packages and data from the old timeseries server.
Data Flow Copied
The Results-Performance reads the results from MessageQueue and then passes the data on to the timeseries manager daemon on port 1600 on the configured host (localhost by default).
The Timeseries manager process launches and monitors worker processes (four by default) which are responsible for parsing and dispatching incoming requests. Write requests (adding more metrics from Results-Performance) are dispatched to Timeseries Enqueuers (localhost on port 1620 by default), while the queries are dispatched to Timeseries RRD Queries (localhost port 1660 by default).
Timeseries Enqueuer passes the data to all configured RRD Updater workers simultaneously (localhost with ports 1640-1643 by default)
The timeseries RRD update worker writes out the data into the rrd files. Opsview Monitor stores RRD data in /opt/opsview/timeseriesrrd/var/data/<hostname>/<servicename>/<metric>/value.rrd.
The timeseries manager, enqueuer and RRD writer daemons can all be installed on separate hosts. However, for network bandwidth usage it is generally better to keep the enqueuer and RRD daemons on the same machine.
Data Storage - RRD Copied
When using RRD (Round Robin Database), numerical values are stored in “time buckets” so there is a single value for each of these buckets. These are the default values used by Opsview:
- Expects a 5 minute interval for values.
- Will keep 5 minute buckets for the last 50 hours.
- Will keep 30 minute buckets for the last 2 weeks.
- Will keep 2 hour buckets for 2 months.
- Will keep 1 day buckets for 2 years.
This means the resolution of data gradually gets “thinned out” over time. When calculating a “bigger bucket” (such as taking six 5 minute buckets and consolidating into a single 30 minute bucket), the average value will be used.
Note
The “RRD heartbeat” is set to 4200 seconds by default, which means that if no values are received after an hour and 10 minutes, there will be gaps in the data. If any value is received during this time, all the buckets during the last hour and 10 minutes will be filled with this value.
InfluxDB Copied
What is InfluxDB? Copied
InfluxDB is a timeseries database created by InfluxData. It is a part of their set of tools focused at performance data which they collect, store, visualise and then raise alerts. We do not provide InfluxDB directly, instead we provide a client component that is able to communicate with InfluxDB to query and store data. The main between InfluxDB and RRD is that InfluxDB does not aggregate the data after 15 days and 30 days and will require a considerably larger amount of disk space than RRD. The suggestion would be to extend the disk or move the InfluxDB data to a dedicated disk.
Use of InfluxDB version 1.8.x is supported. RRD will continue being the default timeseries engine.
InfluxDB has the following differences with RRD:
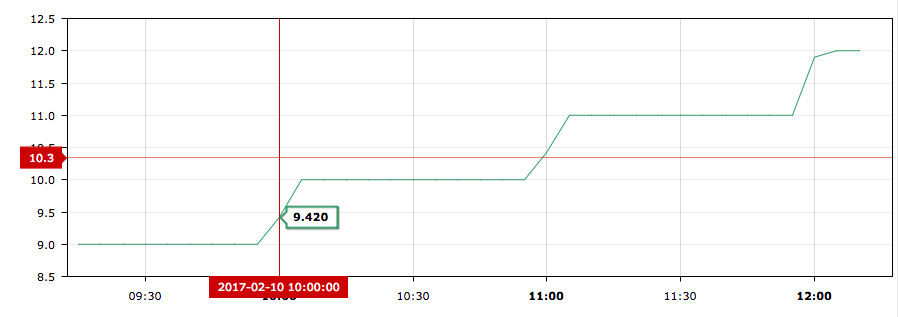
- InfluxDB will store the raw value received, whereas RRD will apply averaging based on the intervals it is defined with. This means RRDs may return non-round numbers for things that should be round (eg: number of bits transferred or number of users), whereas InfluxDB will return whole numbers back when the granularity is small enough (obviously, there maybe fractional numbers when querying the average over a whole day). For example, this is a plugin that returns back the hour it is run in. For RRD, it has an average value of 9.420 at 10:00:
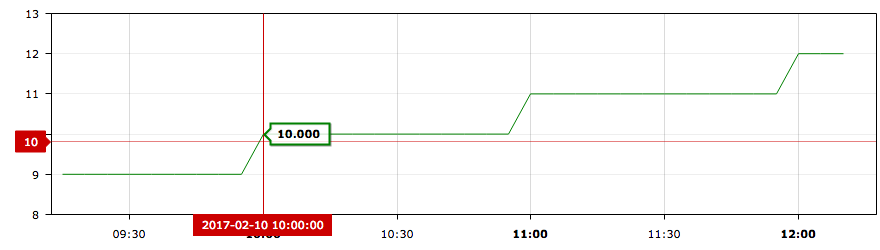
- InfluxDB will show the value of 10 at 10:00:
- RRD has a value for all times going back to the last year, even if that is considered NULL. InfluxDB will only return NULL points when it has got some data for the range requested.
- For counters, RRD stores the last counter value and records the difference based on the step size. InfluxDB stores the actual values of each counter but at query time will return the derivative. If a counter is reset, this would provide a negative difference with the previous value. However, this can be a normal scenario (eg: a device restart resets its counters) - in these cases, we assume the same rate as the previous value. For an initial value that is negative, Opsview will return a NULL point.
Migration from RRD to InfluxDB Copied
Preparation Copied
Make sure system is running the latest packages of Opsview Monitor — see Installation/Upgrade instructions.
Pausing performance metrics processing Copied
# stop processing new performance data
sudo /opt/opsview/watchdog/bin/opsview-monit stop opsview-resultsperformance

# stop Timeseries RRD
sudo /opt/opsview/watchdog/bin/opsview-monit stop opsview-timeseriesrrdupdates
sudo /opt/opsview/watchdog/bin/opsview-monit stop opsview-timeseriesrrdqueries
Extracting existing timeseries data from RRDs Copied
sudo -iu opsview /opt/opsview/timeseriesrrd/utils/rrd2perfdata.pl -i /opt/opsview/timeseriesrrd/var/data -o /tmp/rrd_data
Installing InfluxDB Copied
# download package for your platform and follow the install documentation from InfluxDB
https://docs.influxdata.com/influxdb/v1.8/introduction/installation

# create opsview database
curl -i -XPOST http://127.0.0.1:8086/query --data-urlencode "q=CREATE DATABASE opsview"
Installing Opsview Timeseries InfluxDB Connector Copied
- Amend the Opsview Deploy configuration by amending
/opt/opsview/deploy/etc/user_vars.ymlby adding in the following lines:
opsview_timeseries_provider: influxdb
opsview_timeseries_influxdb_server_url: http://localhost:8086
opsview_timeseries_influxdb_database: opsview
opsview_timeseries_influxdb_retention_policy: autogen
- Remove the current timeseries-rrd packages.
# CentOS/RHEL/OL
yum remove opsview-timeseries-rrd
# Debian/Ubuntu
apt remove opsview-timeseries-rrd
- Then run a deploy as
rootto install the required packages:
cd /opt/opsview/deploy
bin/opsview-deploy lib/playbooks/timeseries-install.yml
Restoring previous timeseries data Copied
- Get the generated username and password for the timeseries connector:
egrep "user|password" /opt/opsview/timeseries/etc/timeseries.yaml
- Substitute
: with the values in the following command:
# copy files into the processing directory
find /tmp/rrd_data/perfdatarrd/ -type f -print0 | xargs -0 -I{} curl -XPOST -u<user>:<passwd> --data-binary "@{}" -H "Content-type: text/plain" http://localhost:1600/write

# restore history
sudo -iu opsview /opt/opsview/coreutils/utils/import_servicecheck_interval_history /tmp/rrd_data/interval-history.tsv
Configure Opsview Copied
- Run a deploy as
root:
cd /opt/opsview/deploy
bin/opsview-deploy lib/playbooks/setup-opsview.yml
bin/opsview-deploy lib/playbooks/setup-monitoring.yml
- Run a reload in the UI.
Configuration Copied
Authentication Copied
Authentication can be enabled on the InfluxDB database to improve security. For more information, see Authentication and authorization in InfluxDB.
To enable Opsview to communicate with InfluxDB using the authentication:
- Add the following variables to the
/opt/opsview/deploy/etc/user_vars.yml:
opsview_timeseries_influxdb_username: <username>
opsview_timeseries_influxdb_password: <password>
- Run the following commands as
root;
cd /opt/opsview/deploy
bin/opsview-deploy lib/playbooks/timeseries-install.yml
Troubleshooting Copied
Drop the whole database and recreate:
# drop
curl -i -XPOST http://127.0.0.1:8086/query --data-urlencode "q=DROP DATABASE opsview"
sudo rm -rf /opt/opsview/timeseriesinfluxdb/var/data/*
# recreate
curl -i -XPOST http://127.0.0.1:8086/query --data-urlencode "q=CREATE DATABASE opsview"
# restart services
sudo /opt/opsview/watchdog/bin/opsview-monit restart opsview-timeseriesinfluxdbupdates
sudo /opt/opsview/watchdog/bin/opsview-monit restart opsview-timeseriesinfluxdbqueries
Drop all metrics for specific host:
$ influx -database opsview
Connected to <a href="http://localhost:8086">http://localhost:8086</a> version 1.6.0
InfluxDB shell version: 1.6.0
> DROP MEASUREMENT "switch1.opsview.com";
Drop all metrics for a specific servicecheck on specific host:
$ influx -database opsview
Connected to <a href="http://localhost:8086">http://localhost:8086</a> version 1.6.0
InfluxDB shell version: 1.6.0
> DELETE FROM "switch1.opsview.com" WHERE service = 'Connectivity - Lan';
Single and double quotes are not interchangeable. For more information, see InfluxDB Documentation.