Withdraw of the 6.9.2 Release
Unfortunately, due to critical issues identified with version 6.9.2, we have decided to remove it and ensure it's no longer available for download. These issues impacted the ability to install or upgrade but none were security-related. We are diligently working to resolve these issues and are planning to release an updated version 6.9.3 in early May.
What if you've already upgraded?For customers who have already upgraded to 6.9.2, no immediate action is required, as none of these issues are security-related. Once it's available, you will still be able to upgrade to 6.9.3 as normal. We appreciate your patience and trust as we continue to enhance our software to better serve you. Thank you for your understanding.
Graph Center
The Graph Center allows you to have a visual representation of the output of Service Checks, as long as they contain numerical performance data (‘perfdata’). This data can then be drawn within the ‘Investigate mode’ window of the Service Check as well as on the Graph Center.
To load the Graph Center, go to the Monitoring > Graph Center page. Initially, there will be no visible graphs.
Graph View Copied
This is the main area of the page where graphs are displayed.
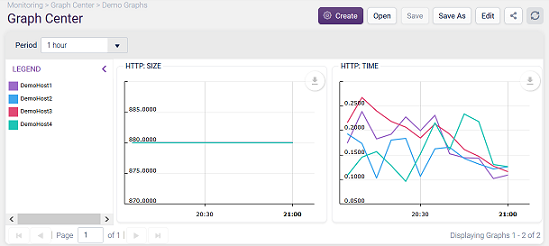
To the left of the graph view, the ‘Legend’ will display every host (line) being displayed on the Graph View, with their matching color. Clicking on individual hosts here will enable or disable that line on every graph.
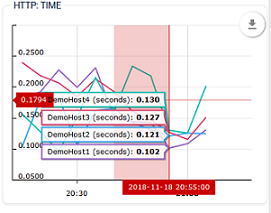
Hovering over any graphs displayed within the Graph View, a marker will display showing the axes values at that time, as well as a value label for each line on the graph.
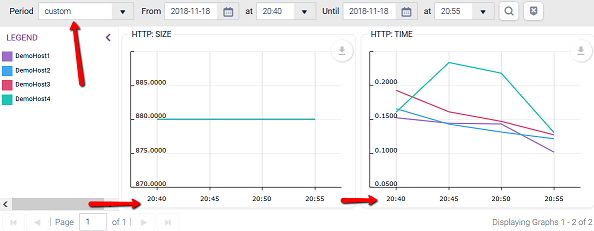
Clicking and dragging over a portion of any graph will set the time period to a custom period that matches your selection as if applying a zoom in to all the graphs to focus on a particular event:
In the top-right corner of each graph, a ‘Down arrow’ button allows you to:
- Download As: save an image of that graph as a .png, .jpg, .svg, or .pdf.
- Save As: to export that graph data to a .csv, .xlsx, or .json file.
- Copy to Dashboard: to add that specific graph into the Dashboard, as a new ‘Performance Graph’ Dashlet. This dashlet is added to the top left of the last used Dashboard.
Time Copied
This dropdown, located in the top-left of the Graph View, allows you to change the start and end date/time of all graphs visible within the current view.
You can choose from the following options:
- 1 hour
- 2 hours
- 3 hours
- 6 hours
- 12 hours
- one day
- one week
- one month
- custom - will allow you to select a specific date/time range. It will also be automatically set when you select a period directly with your mouse in a graph.
- last full day - The last full 24 hour period (00:00 to 00:00).
- last full 7 days - The last 7 full 24 hour periods (00:00 to 00:00).
- last full week - The last full week e.g. if used on Tuesday, this would be the previous Monday - Sunday.
- last full month - The last full month e.g. if used on Feb 5th, this would be Jan 1st - Jan 31st.
Actions toolbar Copied
The Actions are covered in: