Host actions menu
The following options available within the contextual menu of a Host:
- Investigate
- Managed by
- Schedule Downtime
- Recheck
- Acknowledge
- Set Host Check Status
- Set Service Check Status
- Edit Configuration for Host
- Host Interfaces
Investigate Copied
As the Investigate Host functionality has a lot of options, this section will be covered in Host - Investigate Mode.
Schedule Downtime Copied
The Schedule Downtime option, available from a host’s contextual menu, opens a modal window that allows you to define and apply downtime to hosts and service checks.

The upper section of the window contains the following fields:
- Start time: When the Downtime should begin (i.e. the start of the maintenance window), automatically defaults to the current time and date, however you can manually edit this to schedule future downtime.
- End time: When the Downtime should end (i.e. the end of the maintenance window), automatically defaults to one day from the current time and date, however you can manually edit this.
- Comment: User entered free-text describing the reason for the Downtime.
Downtime selection Copied
The lower section of the window provides two tabs that determine how hosts and service checks are selected for downtime.
Status Based Selection Copied
The Status Based Selection tab allows you to select items for downtime based on their current status.
You can schedule downtime in the following ways:
- Select service checks one by one and place only those checks into downtime.
- Select all items to place the host and all associated service checks into downtime.
- Schedule downtime only for service checks in a specific state, such as placing only
CRITICALservice checks into downtime.
Status Selection Copied
Use Status Selection to quickly choose which current statuses (for hosts or service checks) should be scheduled for downtime.
Manual Selection Copied
Use Manual Selection to further refine the status-based selection by choosing specific hosts or service checks to be placed into downtime.
General Selection Copied
The General Selection tab allows you to schedule downtime by explicitly selecting hosts, service checks, or a combination of both.
Button availability depends on your selections:
- If only the Host selection box is populated, both Add Hosts and Add Service Checks buttons are enabled.
- If both the Host and Service Check selection boxes are populated, only the Add Service Checks button is enabled.

Add Hosts Copied
The Add Hosts button adds one or more selected hosts to the downtime list.
- Only the host objects are added explicitly.
- All service checks associated with each selected host are automatically included and affected by the scheduled downtime.
This button is disabled when:
- No host is selected from the dropdown, or
- Both a host and one or more service checks are selected.
Add Service Checks Copied
The Add Service Checks button behaves as follows:
- If no specific service checks are selected, all service checks associated with the selected host are added to the downtime list.
- If one or more service checks are selected, only the specified service checks for the selected host are added.

Filtering the downtime list Copied
The Filter field allows you to filter and refine the entries shown in the table.
- Filtering applies to all columns:
HOST,SERVICE CHECK,STATUS, andSTATUS INFO. - Only rows matching the filter criteria are displayed.
- You can further refine the list by deleting individual rows.
Only the rows currently visible in the table are submitted for downtime scheduling unless the filter is cleared.

Deleting entries Copied
Click Delete Row to remove a selected row from the table.

Clicking the ‘Submit’ button will submit the downtime action for the associated Hosts and Service checks to Opsview Cloud, which will result in either the ‘Pending Downtime’ or ‘Active Downtime’ icon appearing against the Host Group (these icons were outlined in Overview of icons).
Note
When selecting a large number of objects the Manual Selection grid may take some time to populate.
Rechecks Copied
The ‘Recheck’ option within a Host’s contextual menu will open a modal window when clicked, which will look similar to the screen shown below:
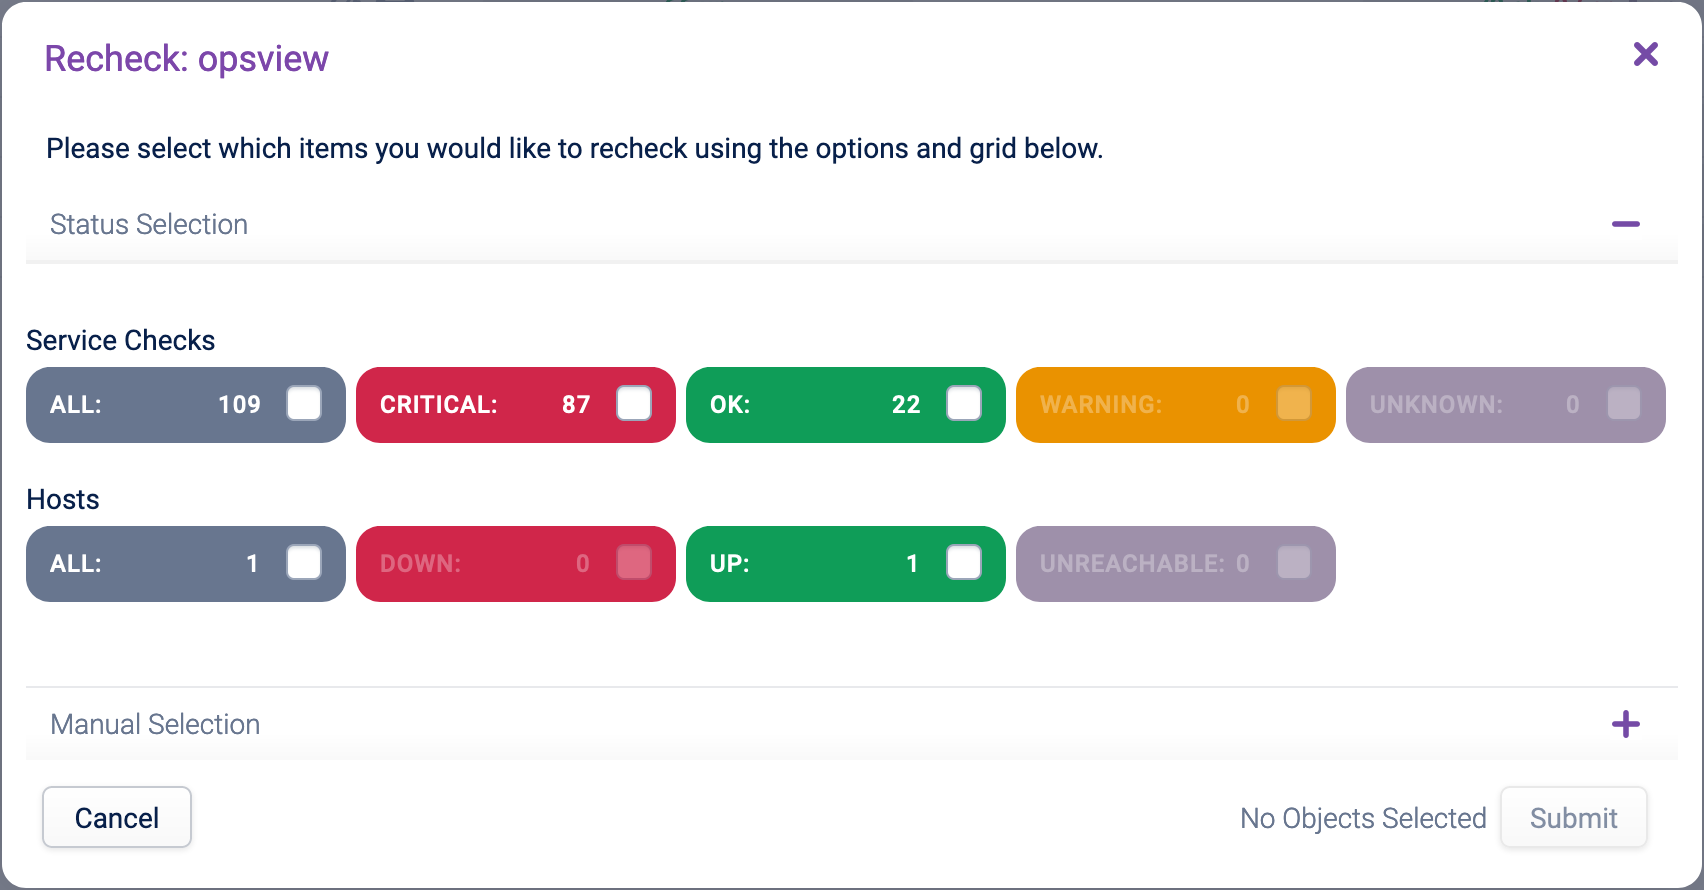
In this window, you have two options to choose the objects that you would like to force a re-check on, as follows:
Status Selection: You can choose to change the status of Service Checks based on their current status, i.e. only change ‘CRITICAL’ Service Checks to an ‘OK’ state, as with the screenshot above.
Manual Selection: You can further refine your Status Selection by selecting the specific Service Checks which you would like to set status on.
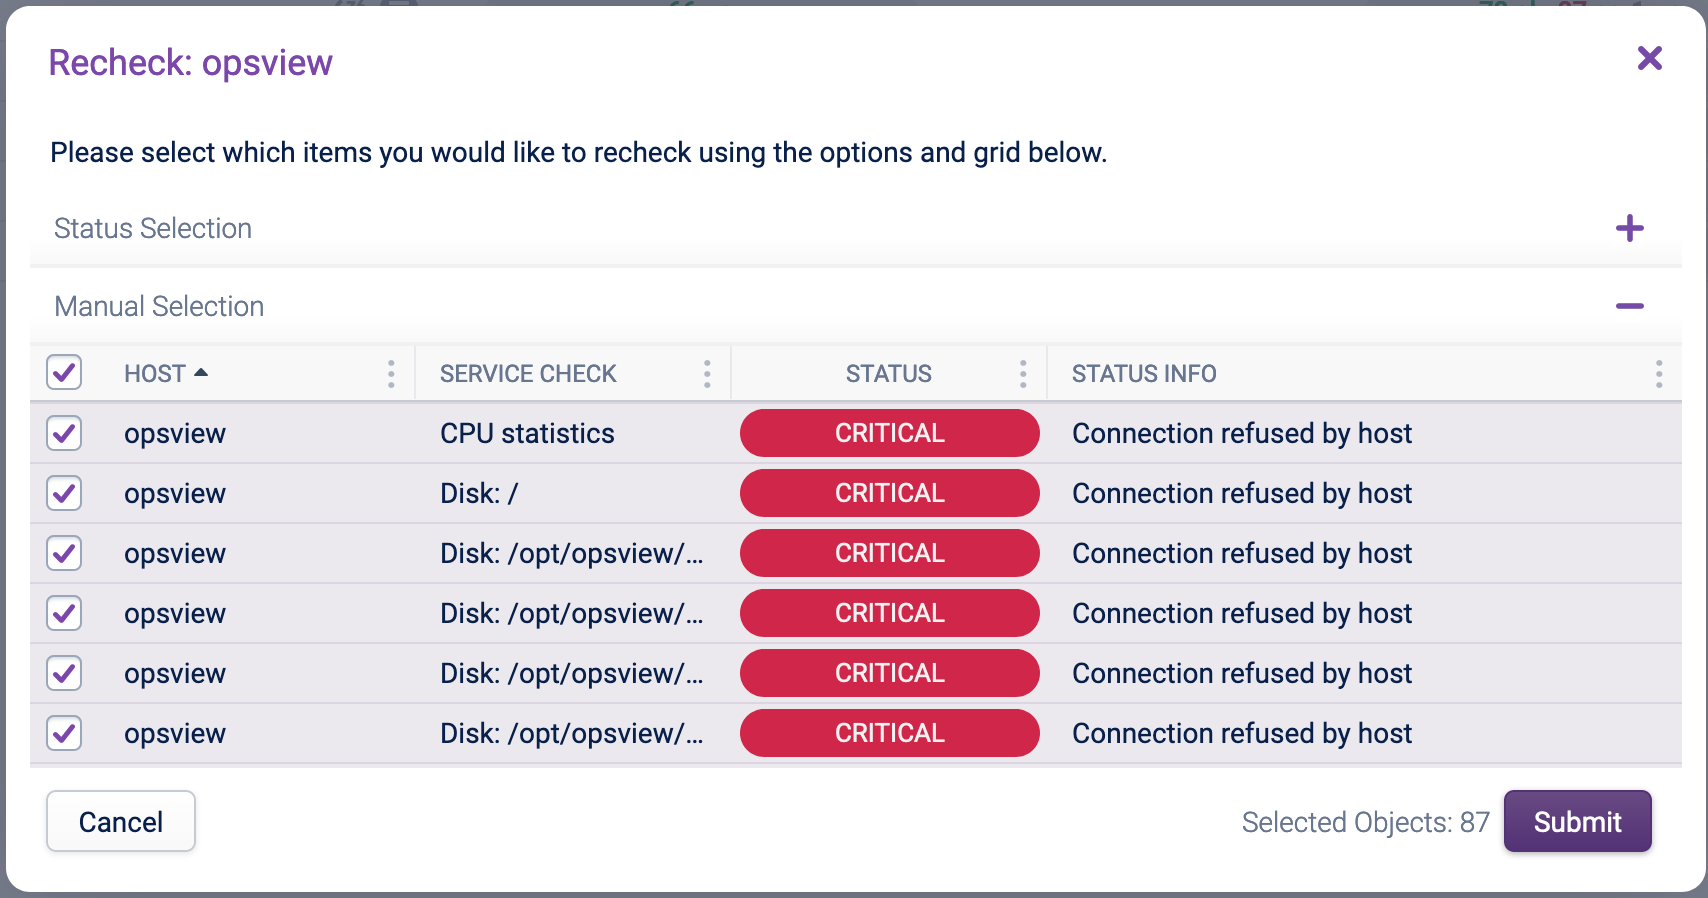
Once you have made your selection, a count of the numbers of objects that have been selected will appear next to the submit button.
Once you have selected your Host and Service Checks, clicking ‘Submit’ will perform the Re-Check.
Note
When selecting a large number of objects the Manual Selection grid may take some time to populate.
Acknowledge Copied
The ‘Acknowledge’ option within a Host’s contextual menu will open a modal window when clicked, which will look similar to the screen shown below:
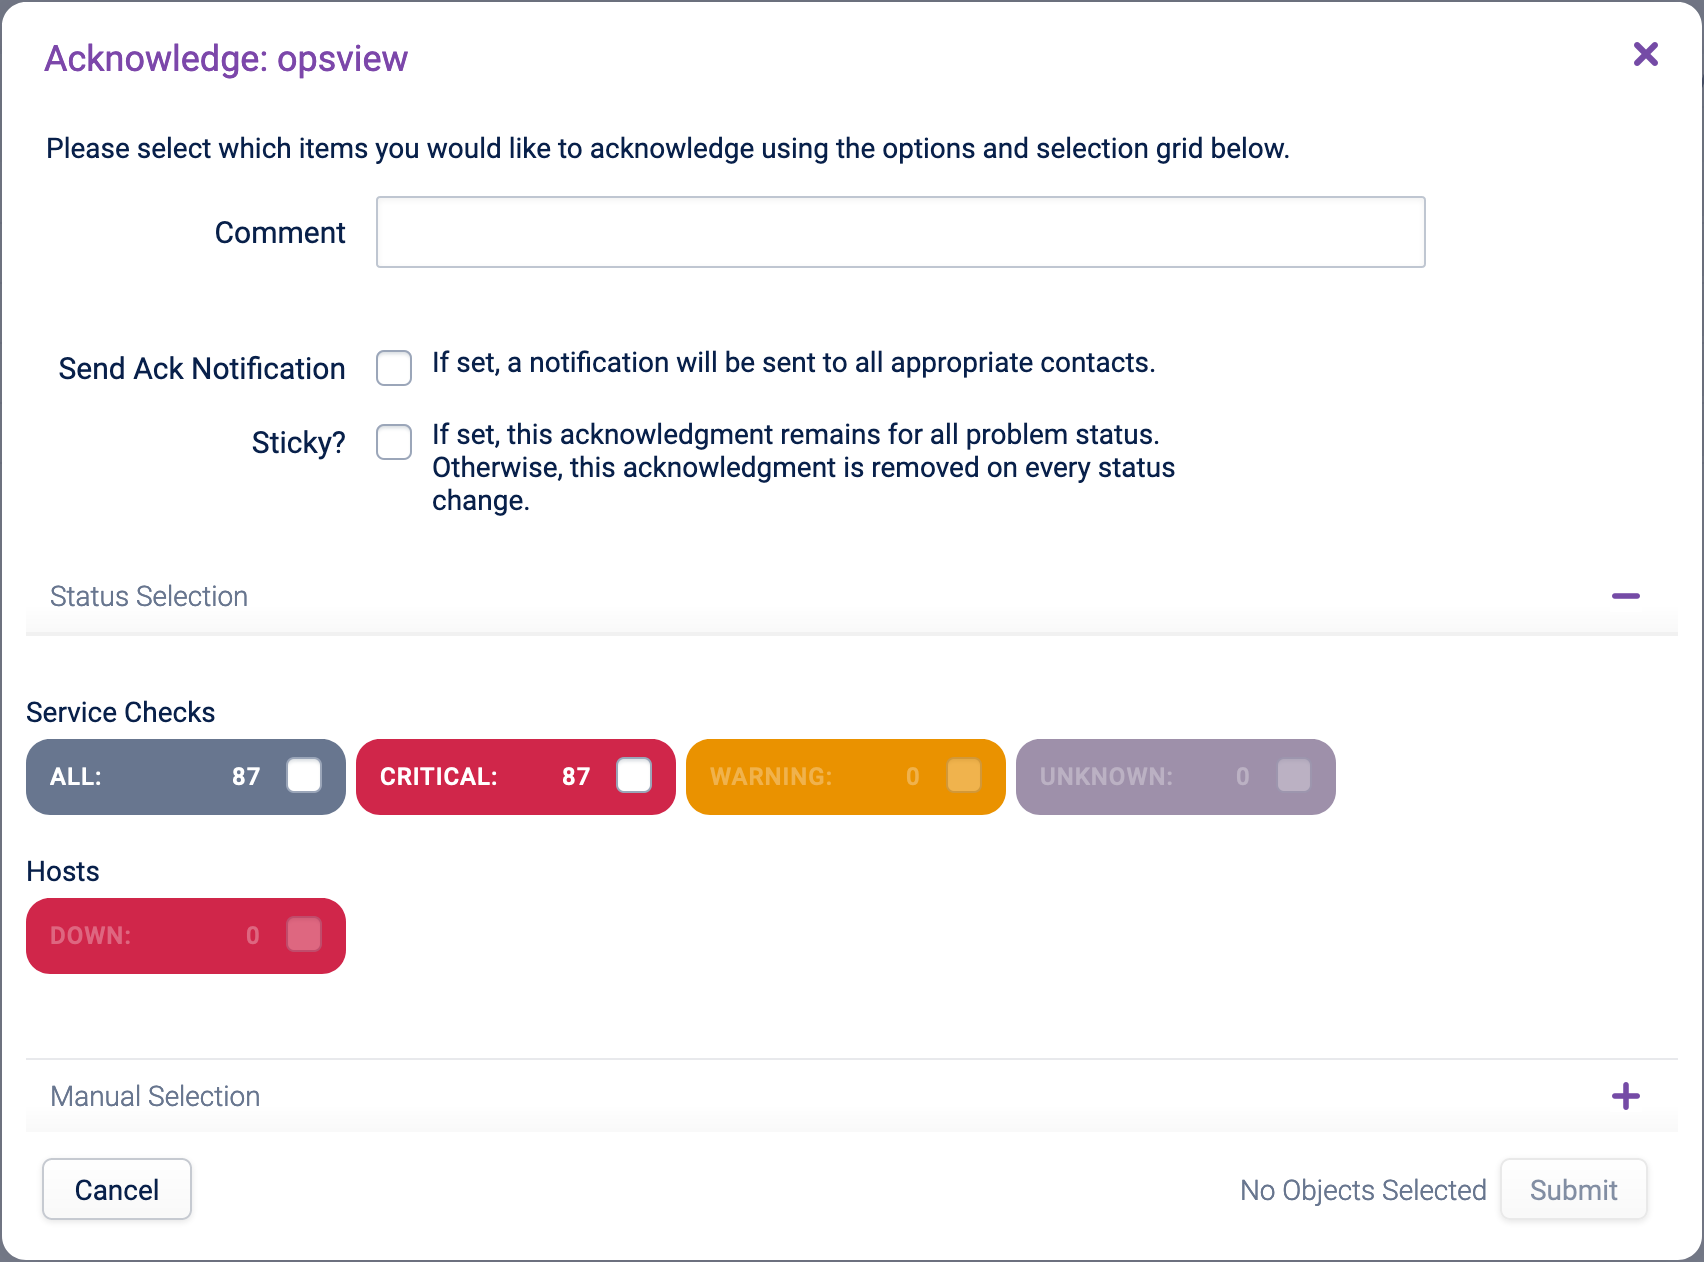
The window allows the User to select various fields in the top half:
Comment: Suitable name for the Acknowledgement
Send Ack Notification: The User can also choose to send an acknowledgement Notification (‘Ack Notification’) from within the modal window, which if checked will send a Notification to the appropriate Users (i.e. those who are set up to be notified about the given Host/Service Checks).
Sticky: There is the option to set the acknowledgement as ‘Sticky’.
“A sticky acknowledgement means that only when the Host or Service Check returns to an ‘UP’ or ‘OK’ state will the acknowledgement be cleared. This is great for when there is a Host flapping between a WARNING state and a CRITICAL state.
In the lower half of the window, you have two options as to choose the objects that you would like to acknowledge (and thus convert into a ‘Handled’ status). This can be done either based on the current status, or you can choose to acknowledge only certain Service Checks based on their state, i.e. only acknowledge CRITICAL Service Checks. The two selection options are as follows:
Status Selection: Here you can quickly choose which of the current statuses of your Service Checks that you would like to set into the previously chosen status.
Manual Selection: You can further refine your Status Selection by selecting the particular Service Checks which you would like to set status on.
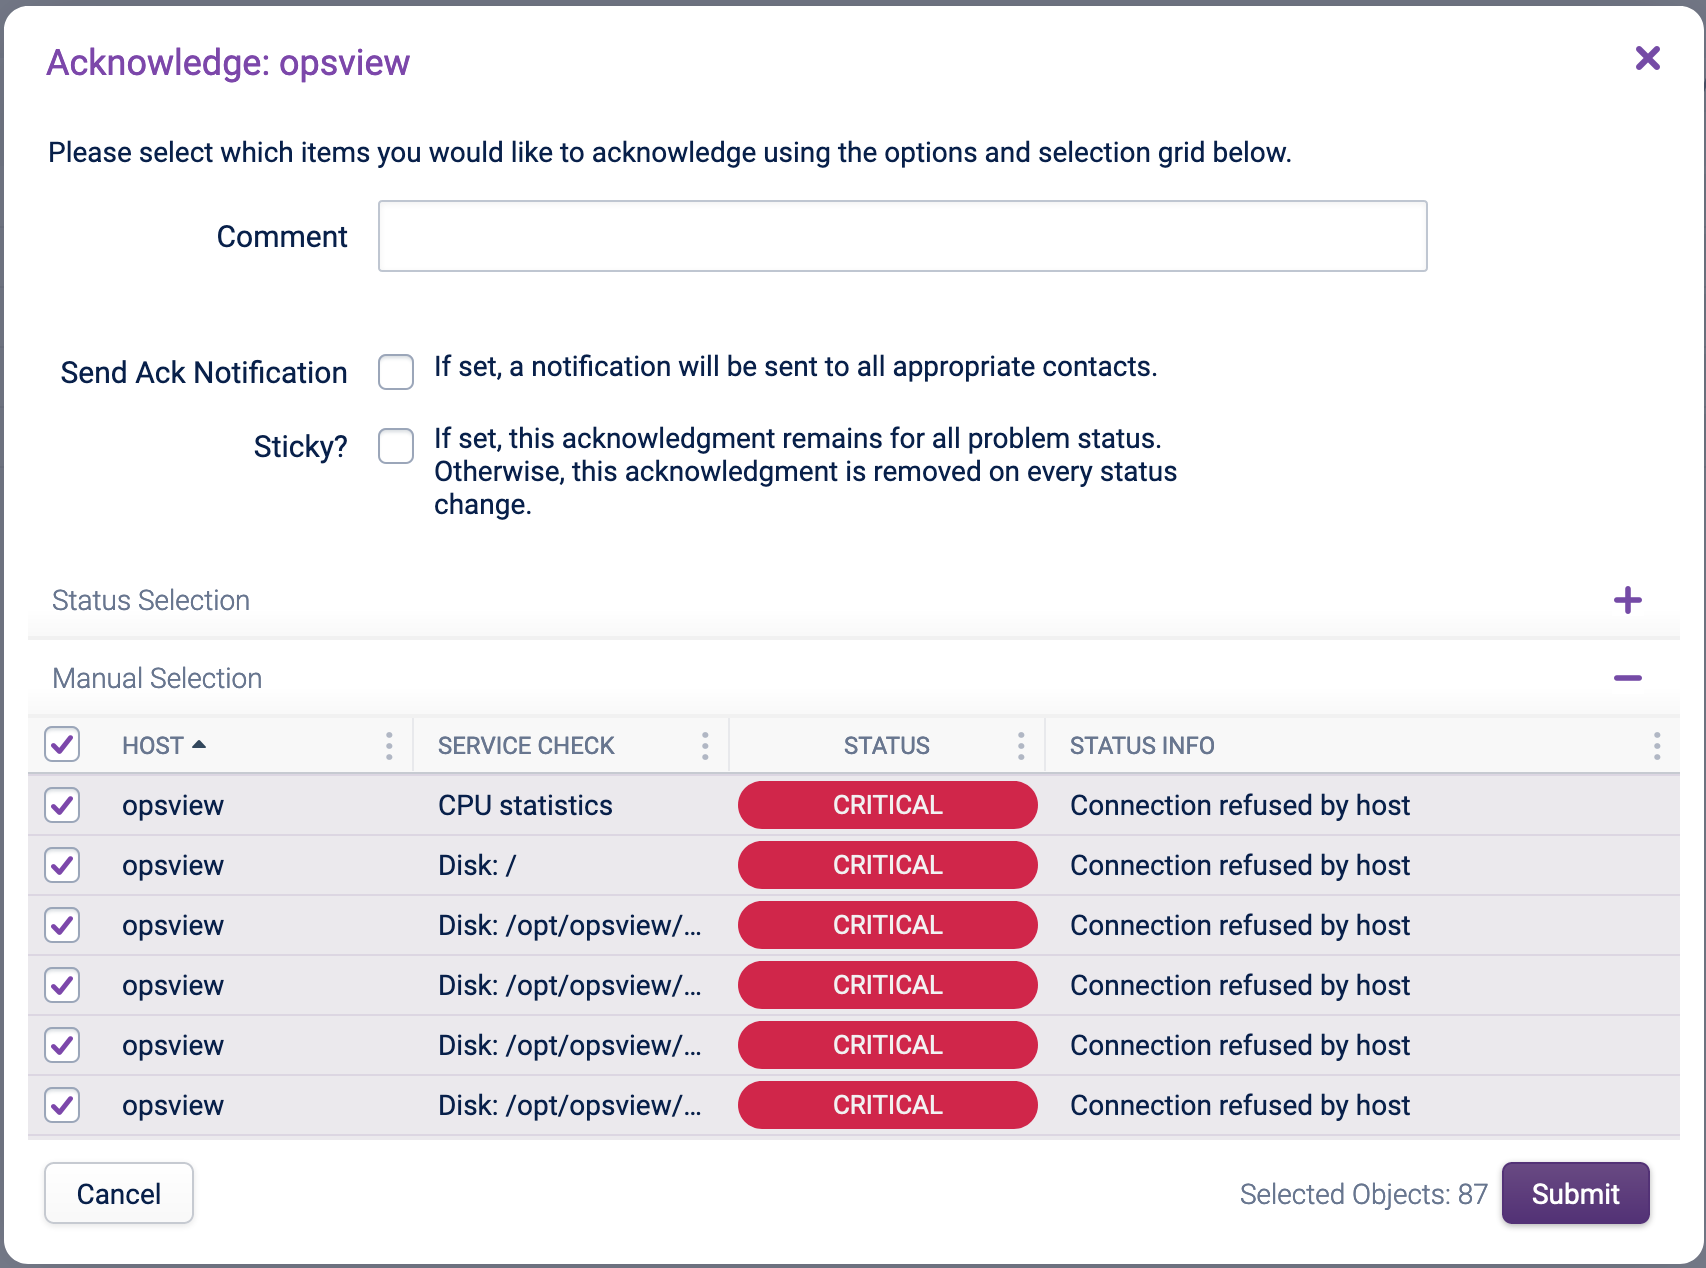
Once you have made your status selection, a count of the numbers of objects that have been selected will appear next to the submit button.
Clicking the ‘Submit’ button will perform the Acknowledge and set it to make the user aware if a Host or Service Check is in a ’non-ok state’ to send a message forward.
Only Hosts are not ‘UP’ and Service Checks that are not ‘OK’ can be acknowledged.
Note
When selecting a large number of objects the Manual Selection grid may take some time to populate.
Set Service Status Copied
The ‘Set Service Status’ option within a Host’s contextual menu will open a modal window when clicked, which will look similar to the screen shown below:
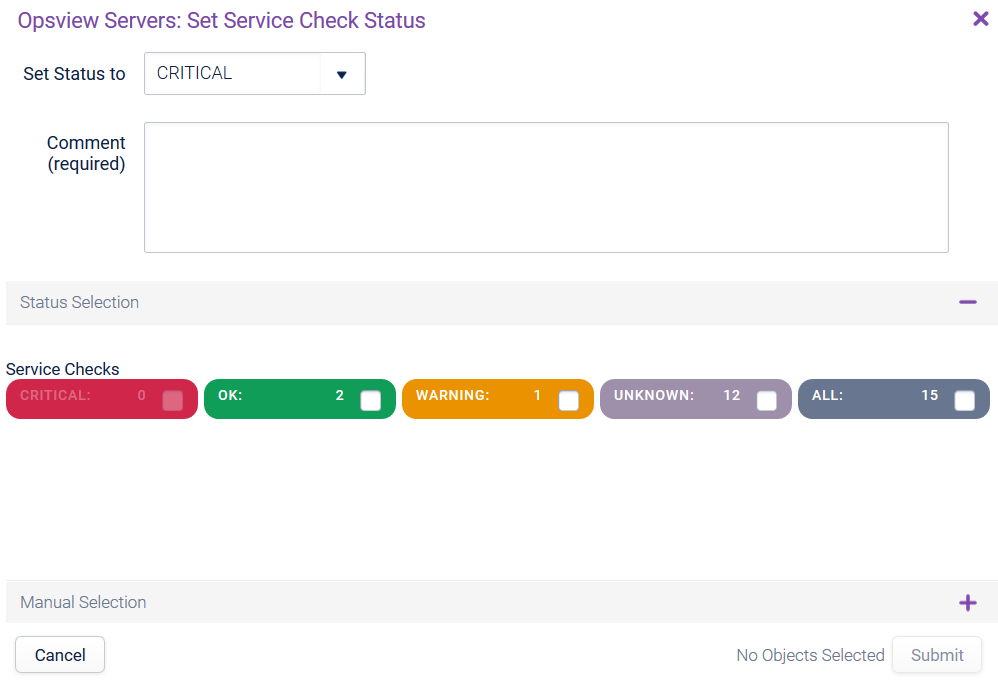
The window allows the User to select various fields in the top half:
Set Status to: This is the status you would like to set particular Service Checks to
Comment: User entered free-text describing the reason for the manually setting the Service Check status.
In the lower half of the window, you have two options as to choose the objects that you would like to set the service status on. This can be done either based on the current status, or you can choose to change the status of only certain Service Checks based on their current status, i.e. only change ‘CRITICAL’ Service Checks to an ‘OK’ state, as with the screenshot above. The two selection options are as follows:
Status Selection: Here you can quickly choose which of the current statuses of your Service Checks that you would like to set into the previously chosen status.
Manual Selection: You can further refine your Status Selection by selecting the particular Service Checks which you would like to set status on.
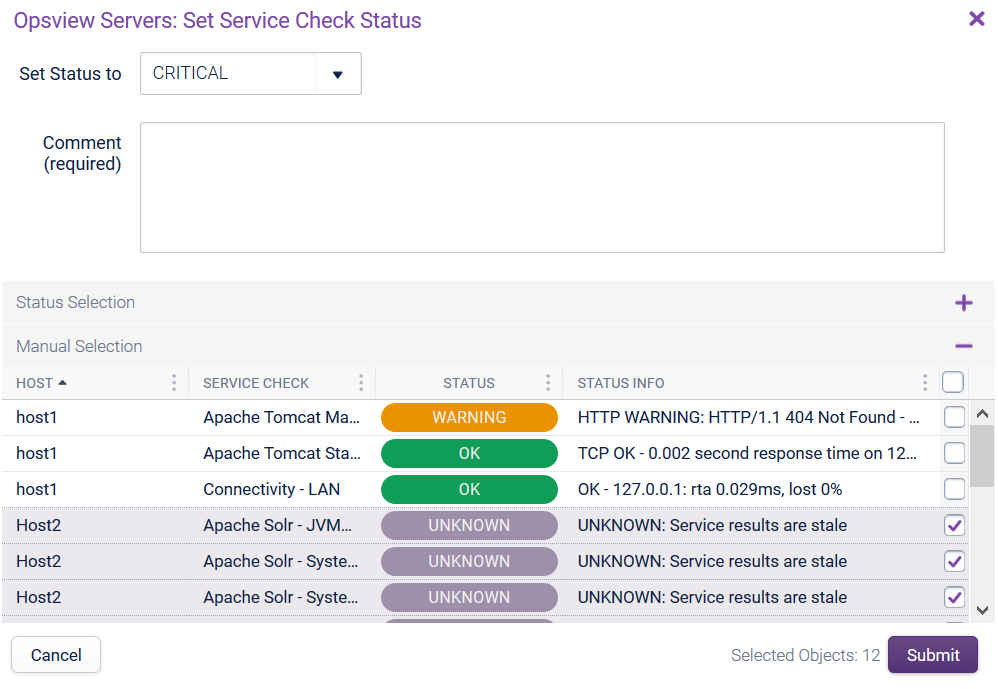
Once you have made your status selection, a count of the numbers of objects that have been selected will appear on the left hand side next to the submit button.
The ‘Submit’ button will then perform the Set Service Check Status for the selected Service Checks.
Please note, if an OK Service Check is changed to a non-OK status, i.e. CRITICAL, WARNING or UNKNOWN, the Check Interval will change to that of the ‘Retry interval’. This means that the Service Checks you have changed from OK to CRITICAL, for example, will likely return to the OK state within one minute – unless the Retry Interval is modified.
Note
When selecting a large number of objects the Manual Selection grid may take some time to populate.
Set Host Status Copied
The Set Host Check Status for a host will look like the model below:
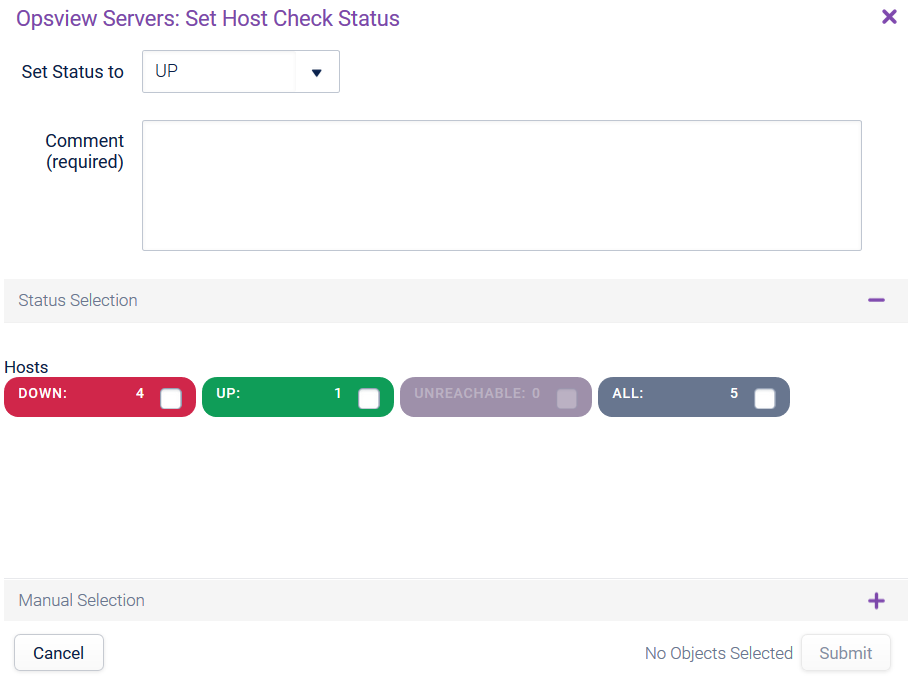
Set Host Check Status can be used to forcibly change the status of a Host. For example, you may wish to test that Notifications are working for a key Host Check. You could either amend the Host Check and wait for it to fail or you could use ‘Set Host Check Status’ to forcibly change the Host check to ‘DOWN’, thus triggering the notifications.
Note
In order to force the Notification to trigger in this example, a number of ‘Set Host Check Status’ changes must be submitted within the ‘Retry Interval’ to order to pass the configured ‘Max Check Attempts’ limit (by default, ‘Max Check Attempts’ is three and the Retry Interval is one minute).
Comments can also be added when a Host Check status is changed, i.e. “Changing to down to test Notifications”. As the Host Check is changed to DOWN in our example, the ‘Retry interval’ will kick-in and the Host Check will be re-checked automatically (thus likely to return to an OK state within 1 minute)." seems unnecessary as the example screenshot does not match.
Host Interfaces Copied
The ‘Host interfaces’ option within a Host’s contextual menu will open a modal window known as ‘Investigate mode’, focused on the ‘Host Interfaces’ tab. This will look similar to the screen shown below:
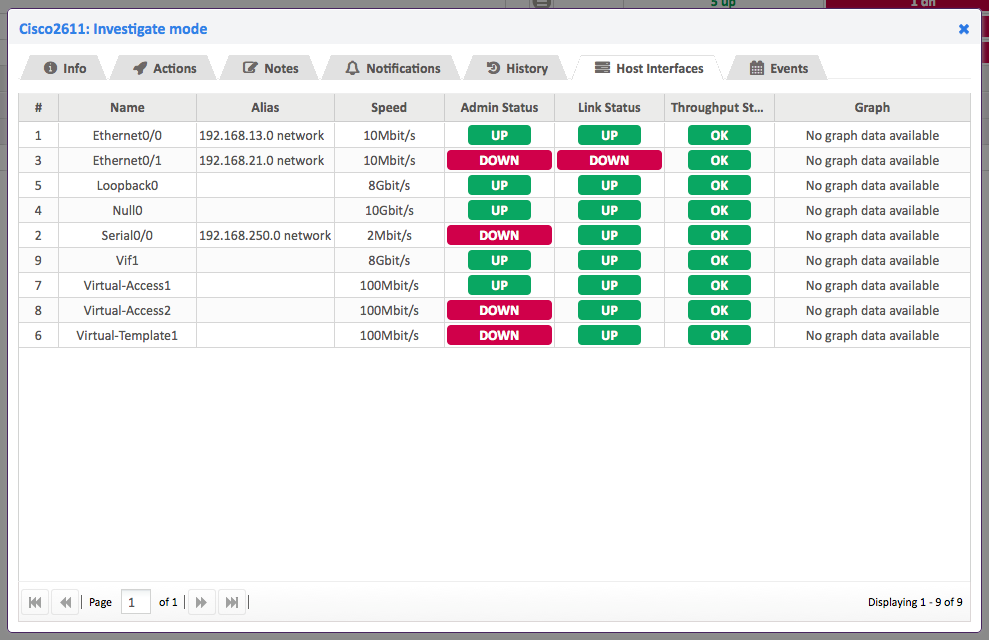
The Host interfaces tab is populated with data from the interfaces of the Host, as specified in the ‘SNMP > Interfaces’ section of that Hosts configuration (see Section Configuring a Host: ‘SNMP’ tab for configuration information).
The tab will display all interfaces set to be monitored within the aforementioned configuration section and is a great way to see how busy each interface is on the specified Host.
Edit Configuration for Host Copied
The ‘Edit Configuration for Host’ option within a Host’s contextual menu will open the edit window for the selected Host focusing on the ‘Host’ tab, as seen below:
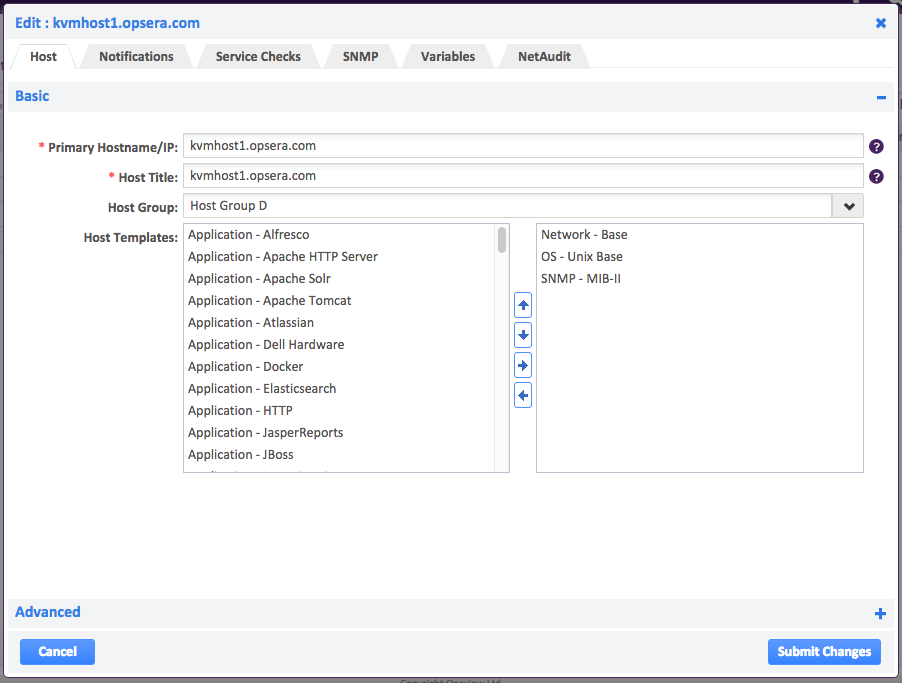
If you have suitable permissions, the link provides you with the ability to modify a Hosts configuration directly from the ‘Navigator’ page.
On clicking the Submit Changes button or the Cancel button, you will go to the Configuration > Hosts page.