Navigator
Monitoring data analysis Copied
You should now be comfortable with the creation, removal and modification of Service Groups, Host Templates and Service Checks, and the application of these items to Hosts. Once the Service Checks and Host Templates have been configured and applied to Hosts, you can begin to analyze and interpret the monitored data from the Navigator page accessible from the Configuration menu.
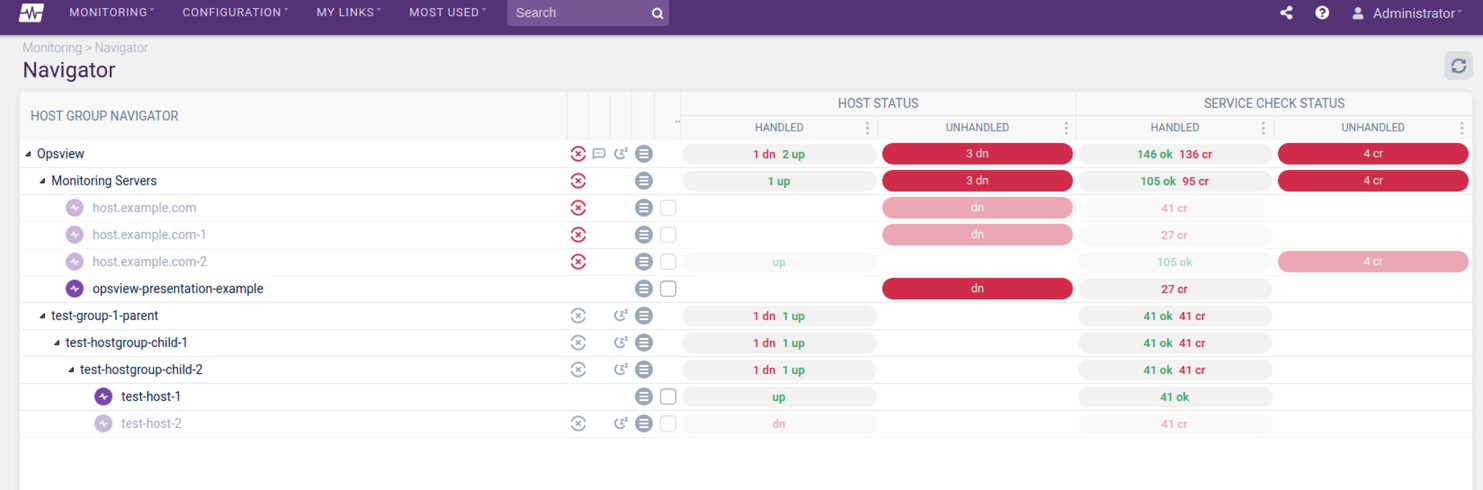
This page allows a range of functions such as investigation or a set of ‘actions’ at a Host Group/Host Service Check level. The Navigator is split into two ‘sections’. The top half represents the hierarchical organization of hosts within host groups. The bottom half is known as the Checker where you can see details for selected hosts.
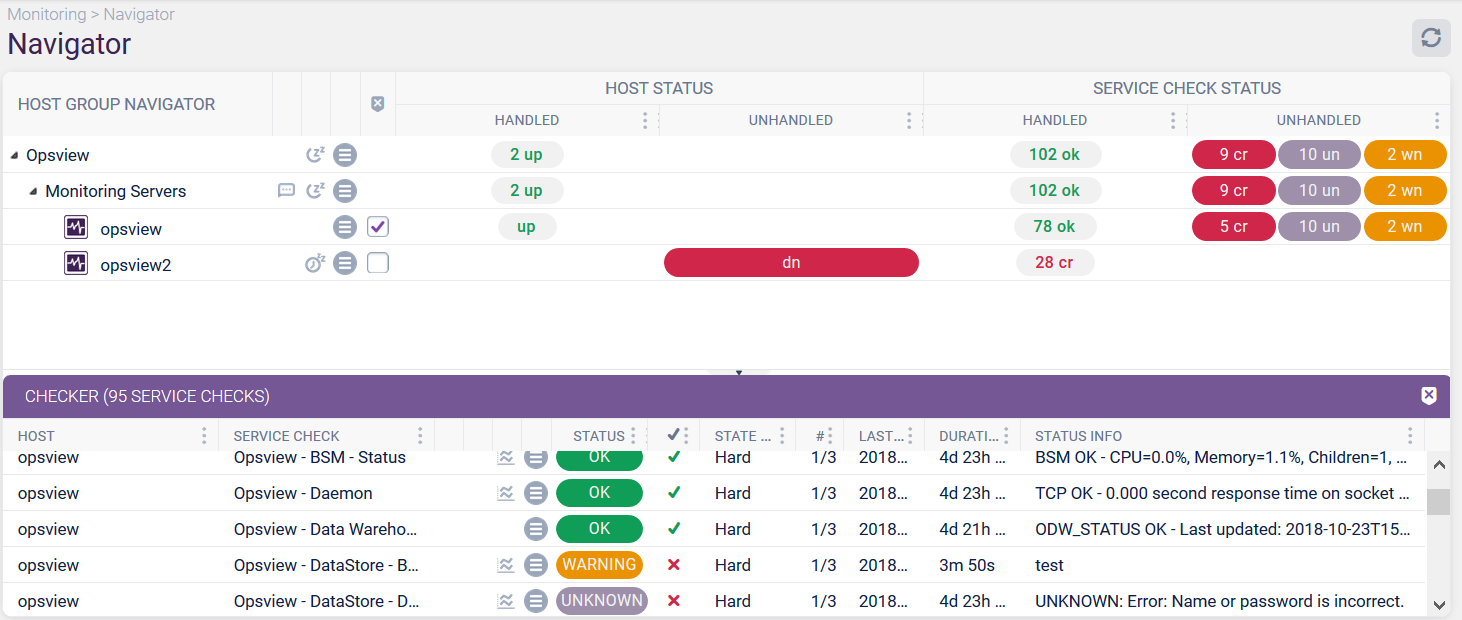
The first five columns of Navigator are:
- Name — object name from either the Host Group or the Host.
- Notes — display a clickable icon if there are any notes associated with the object.
- Downtime — display either the downtime in progress icon, or the scheduled downtime in future icon based on any object within this part of the hierarchy is in either state. If there is no downtime, no icon will be displayed.
- Contextual Menu — provides more options for the object in this row.
- View Checkbox — checkbox used to select the host to populate the Checker.
The right-half of the navigator contains the status information for both the Hosts and their Service Checks. The status information is split into two sections:
- Host Status — refers to the state of the Host as defined by the results of the Host Check Command associated with it.
- Service Status — refers to the service checks running on those Hosts.
- Hosts that are
DOWN(denoted as dn), mean that the Host Check Command has failed to get a response from the Host - Hosts that have failed service checks can be
CRITICAL(cr),UNKNOWN(un), or inWARNING(wn). - Hosts that have an
OKstatus from the Host Check Command are categorized asUP.
- Hosts that are
- Handled vs Unhandled — each of the Host Status or Service Status columns are split into Handled and Unhandled.
A Host is Handled if any of the following are true:
- The status is
UPorUNREACHABLE. - It has been acknowledged.
- It is in a period of downtime.
Otherwise, the Host is Unhandled.
A Service is Handled if any of the following are true:
- Its Host is
DOWNorUNREACHABLE. - The Service status is
OK. - The Service has been acknowledged.
- The Service is in a period of downtime.
Otherwise, the Service is Unhandled.
In simple terms, Unhandled is a new problem that you are not aware of.
You should use Scheduled Downtimes for planned outages and Acknowledgements for unplanned outages.
Filtering the Navigator Copied
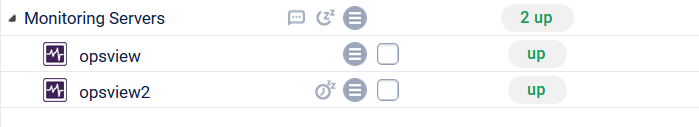
You can filter what is displayed in the Navigator by clicking on any of the displayed numbers. Clicking 2 up at the Monitoring Servers row will then display only the data from that Host Group:
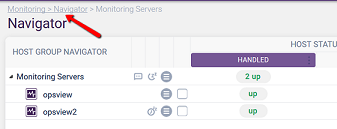
Another useful way of filtering is by clicking on any of the statuses numbers. To return to the top level, click on the breadcrumb in the title area:
Viewing a Host’s Service Checks in the Checker Copied
The Checker contains the Service Checks from the Hosts that you have selected within the upper part of the screen. This section of the documentation covers the Checker, including an overview of icons and what they mean, how to add Hosts to the Checker, how to filter the Checker and how to clear all data from the Checker.
Visualizing data of a Host in the Checker Copied
To view the Service Checks of a Host, select the checkbox next to the Host’s contextual menu:
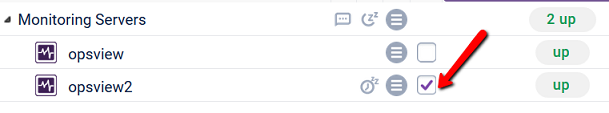
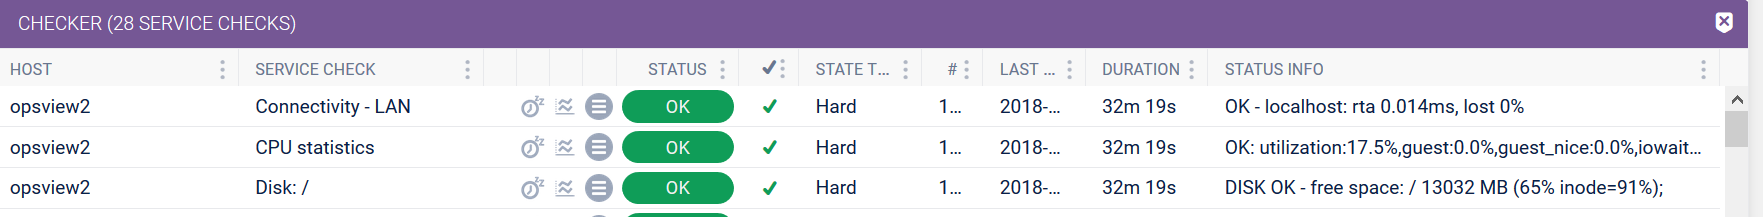
Within the Checker window, the Service Checks data for the selected Host are displayed:
To view the Service Checks of multiple Hosts within the checker, simply check multiple check boxes.
The available columns in the grid are:
- Host — name of the Host.
- Host Group — name of the Host Group of the Host.
- Network Address — network address of the Host.
- Host Description — description of the Host.
- Service Check — name of the Service Check.
- Service Notes — if the service has notes, an icon will appear in this column.
- Service Downtime — if there is downtime active or pending, an icon will appear in this column.
- Graph View — if there is graphing data, an icon will appear in this column.
- Status — status of the Service Check.
- ✔️ — if this Service Check is handled or unhandled.
- State Type — soft or hard state type of the Service Check.
- Check Attempt # — current check attempt of the Service Check.
- Last Check — time of the last check of the Service Check.
- Duration — duration of the current state of the Service Check.
- Status Info — current information of the Service Check, usually from the plugin.
Most columns are hideable, sortable, resizable, and reorderable.
The Status Info column will truncate any data that is too long and add replace it with ellipses. If you click on the cell, more information will be revealed. Note that after a refresh of data, the cell will go back to truncated mode.
There is also an Expand All Rows option in the grid header menu:
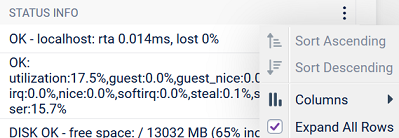
If this is checked, then all the rows will be expanded. This option will persist when a refresh of data occurs and also when saving or sharing a link. Click on the status info if you wish to shrink the row again.
Icons Copied
Within both the Navigator and Checker a series of ‘badges’ are used to denote a status / available action against a given Host Group, Host or Service Check. The available badges are:
![]()
Monitoring System Health Copied
Additional icons are displayed on screen when a hostgroup or host is impacted by a Monitoring Server issue. These additional icons are below and further information on the Clusters page may be found here:
| Icon | Description | Row Greyed Out and Links Disabled |
|---|---|---|
| Denotes the monitoring server cluster or collector that is currently offline. | Yes | |
| Monitoring server cluster or collector performing the monitoring of host is offline. | Yes | |
| Monitoring server cluster or collector is partially offline; devices are being monitored but the service is degraded. | No |
The tooltips provide further information about the issue and the icons themselves are links which will take you to the Monitoring Clusters configuration page (if you have a suitable role with access) for further investigation.
Filtering/Sorting within the Checker Copied
Within the Checker, Service Checks can be sorted and filtered using the contextual menus within the column headers. For example, you can compare the metrics against two different Hosts. To do this, simply click on the Service Check header which will sort the data in the Checker A-Z/Z-A, as below. You can also enter the name of the Service check you want to filter on by clicking on the three dots in the header and using the Filter:
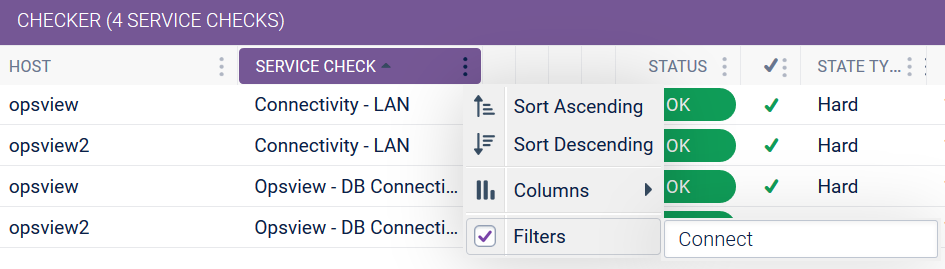
Other columns can also be filtered.
Sharing a View Copied
The filtered/configured ‘Navigator’ page can be shared to other users via the ‘share’ icon in the top bar.
This share icon can be used to generate a unique URL, which when navigated to will load the view as it was when the URL was generated:
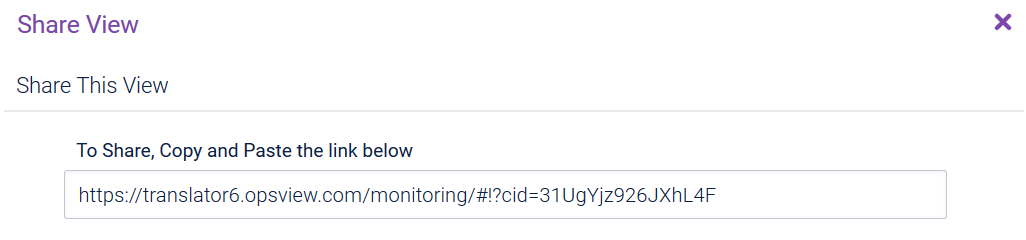
This means that if you select 100 hosts from disparate host groups, and filter the ‘Checker’ for only ‘CRITICAL’ state service checks, you can generate and share a URL which, when loaded by other users, will give them the exact same view that you are seeing.
Removing Data from the Checker Copied
There are three ways to remove data from the checker:
-
Remove each Host one by one by clicking on the checkbox.
-
Remove all Hosts (i.e. ‘Clear’ the checker), using the icon in the top right of the Checker:

-
Remove all Hosts, using the icon in the top of the Navigator title bar:
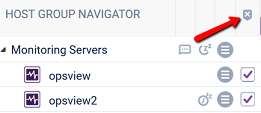
If there are no Hosts left in the Checker, the Checker window will be minimized to the bottom of the screen.
Actions Copied
A set of action are available through the hamburger menus. Here are some generic concepts applicable to Host Groups, Hosts and Service Checks:
Schedule Downtime Copied
Downtime provides you with the ability to set ‘maintenance windows’ within Opsview Cloud, when you foresee potential failures within a given date and time, due to activities such as patching of the operating systems may occur. By setting up Opsview Cloud in advance, the Schedule Downtime functionality will not spam you with Notifications when the foreseen ‘problems’ are detected in the given timeframe.
In SLAs within the Reports module, failures during a downtime window will be considered as ‘scheduled downtime’ rather than ‘unscheduled downtime’.
Downtime can be set at:
- Host Group level, which propagates to all Hosts and Service Checks within the Host Group into a state of Downtime during the determined period.
- Host level, thus affecting the specified Host and its Service Checks.
- Individual Service Check on an individual Host, e.g. ‘Apache2’ on Host ‘www-data’ will be updated between 15:00 and 15:30, so you could schedule downtime to prevent notifications.
Rechecks Copied
Rechecks allow you to force a manual check before the next regular check interval. They can be executed at:
- Host Group level, thus re-checking all Hosts (Host checks) and Service Checks within the Host Group.
- Host level, thus re-checking the Host (Host check) and all of its Service Checks.
- Service Check level, thus re-checking just the individual Service Check.
Note
This will only list hosts and services that are recheckable (as it doesn’t make sense to recheck a passive service check or an SNMP Trap service check). If a service is cascaded from another (for example, Interfaces Poller will send results to “Interfaces: *”), then these will be listed, but when a recheck is requested from the cascading service check.
Acknowledge Copied
All Hosts that are in an ‘UP’ state, or Service Checks that are in an ‘OK’ state, are automatically considered ‘handled’ and cannot be acknowledged.
Acknowledgements are available when a Host or a Service Check is in a non-OK state. Acknowledgements allow you to ‘handle’ a problem, for example, tell Opsview Cloud ‘I am aware of the problem’. By acknowledging a Service Check/Host in a non-OK state, Opsview Cloud will move the affected items from an Unhandled to a Handled state, which affects the views within the Navigator section of the ‘Host Groups, Hosts and Services’. Acknowledgements are primarily a method of disabling Notifications for a Host or Service Check and adding a comment to summarize the current situation for the given Host/Host Group as a way of dealing with unplanned problems.
There are two types of acknowledgements:
- Normal: If the Host or Service Check’s state changes from a non-OK state to any other state (e.g. from Warning to Critical), the acknowledgement is cleared and notifications will be re-enabled.
- Sticky: Only when the Host or Service Check returns to an
UPorOKstate will the acknowledgement be cleared and notifications will be re-enabled. This is often useful for when a Host or Service Check is flapping between a WARNING state and a CRITICAL state.
All comments associated with an acknowledgement (sticky or normal) will be cleared when the acknowledgement is removed.
Set Service Status - for Hosts and for Service Checks Copied
Set Service Status can be used to forcibly change the state of a Host or Service Check at a Host Group, Host or Service Check level. For example, you may wish to test that Notifications are working for a key Service Check. You could either amend the Service Check and wait for it to fail or you could use ‘Set Service Status’ to forcibly change the service check to ‘CRITICAL’, thus triggering the notifications.
Note
In order to force the Notification to trigger in this example, a number of ‘Set Service Status’ changes must be submitted within the ‘Retry Interval’ to order to pass the configured ‘Max Check Attempts’ limit (by default, Max Check Attempts is three and the Retry Interval is one minute).
Comments can also be added when a Service Check status is changed, e.g. ‘Changing to critical to test Notifications’. As the Service Check is changed to CRITICAL in our example, the ‘Retry interval’ will kick-in and the Service Check will be re-checked automatically (thus likely to return to an OK state within 1 minute).
Notes Copied
Notes can be entered for Host Groups, Hosts and Service Checks using the contextual menu. Notes are free-text; a WYSIWYG editor is provided where you can add notes to items within Opsview Cloud for future reference, e.g. adding a note against a router with information about VLANs, routing tables, etc.
Investigate Copied
Investigate is an option that is available in the contextual menus of Hosts and Service Checks. When you click on ‘Investigate’ a modal window will appear with all the relevant information for the Host or Service Check. The concept behind ‘investigate’ is to provide you with a single view into every facet of the Host or Service Check selected, including event information, graphs, testing, notifications and more.
| Components | Host Groups | Hosts | Service Checks |
|---|---|---|---|
| Schedule Downtime | Yes | Yes | Yes |
| Rechecks | Yes | Yes | Yes |
| Acknowledge | Yes | Yes | Yes |
| Set Host Check Status | Yes | Yes | No |
| Set Service Check Status | Yes | Yes | Yes |
| Notes | Yes | No | No |
| Investigate | No | Yes | Yes |
| Managed by | No | Yes | No |
| Edit configuration for Host | No | Yes | Yes |
| Edit configuration for Service Check | No | No | Yes |
| Troubleshoot | No | No | Yes |