Business Service Monitoring Dashlets
You can perform more analysis of your Business Services and Components within the Monitoring > Dashboards page.
For more information on adding new dashboards and dashlets, see the Dashboards page.
There are three BSM dashlets available:
- BSM Summary: Displays all Business Services, sorted by status (offline first).
- BSM Service: Display the Business Service, its Components, and the Hosts within each component.
- BSM Component: Displays the Component, the Hosts within the Component, and also the health of all Business Services using this Component.
BSM Summary Dashlet Copied
The BSM Summary dashlet will display the health of all of the Business Services within your Opsview Cloud system:
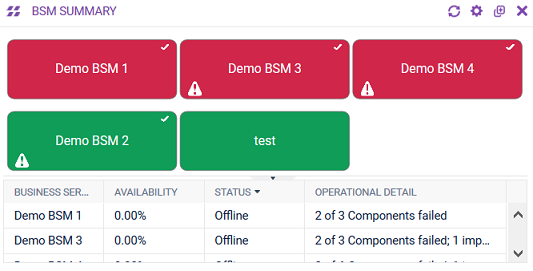
In the dashlet above, you can see a ‘cell’ per Business Service and then a table below which contains relevant information such as availability (SLA), status, and operational detail. This table can be minimized/collapsed.
If a Business Service is ‘operational’ it means all the Components ‘inside it’ are online, i.e. not failed. However, if a Component is online but has a Host that is failed, it is considered ‘impacted’, and a ‘warning triangle’ will show; the ‘operational detail’ column will display ‘1 of X component(s) impacted’.
By clicking on the cog at the top right of the dashlet, you can configure what information you would like to be displayed:
- Filter by Business Service: Only display the selected Business Services within the dashlet
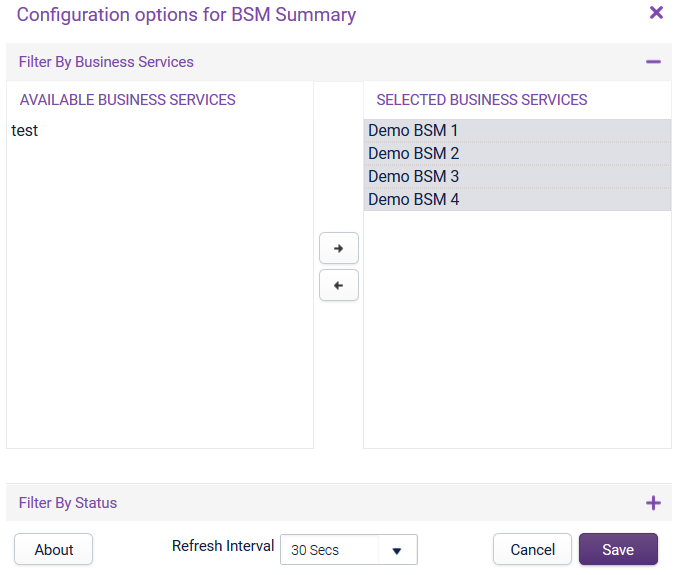
- Filter by Status: Only display Business Services that are in a specified status, i.e. only show ‘Offline’ Business Services.
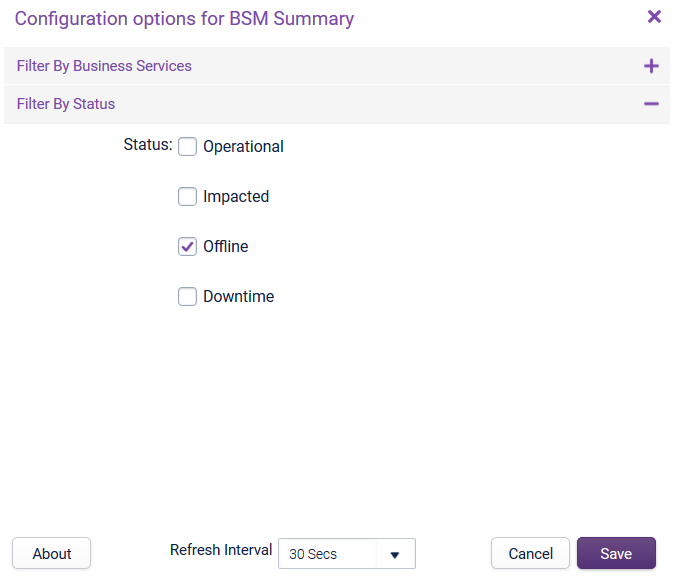
The two types of filters are combined, i.e. “only show me ‘BSM 1’ and ‘BSM 2’, only if they are ‘OFFLINE’”.
BSM Service Dashlet Copied
The BSM Service dashlet will display the end-to-end health of the specific Business Service:
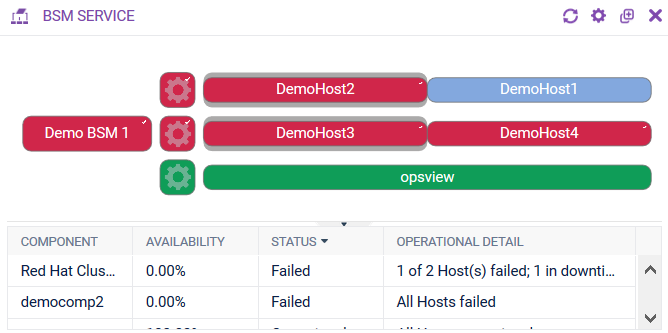
In the example above, we have chosen the ‘BSM 1’ Business Service, which contains three Components and a total of five hosts and also the operational zone - which is the ‘grey background’ around the Hosts.
Beneath the end-to-end graphic, the statistics of the Component(s) are displayed in a table. These statistics include the Component name, Availability (OLA), Status and Operational Detail. If a Component contains a Host that is failed, it will be listed in the Operational Detail. This table can be minimized.
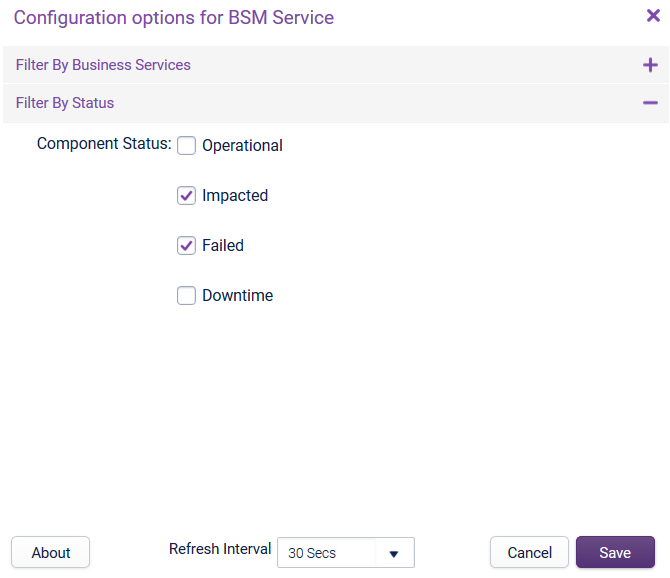
By clicking on the cog at the top right of the dashlet, you can configure what information you would like to be displayed:
- Filter by Business Service: Allows you to choose a specific Business Service and also choose which Components within that Business Service are displayed.
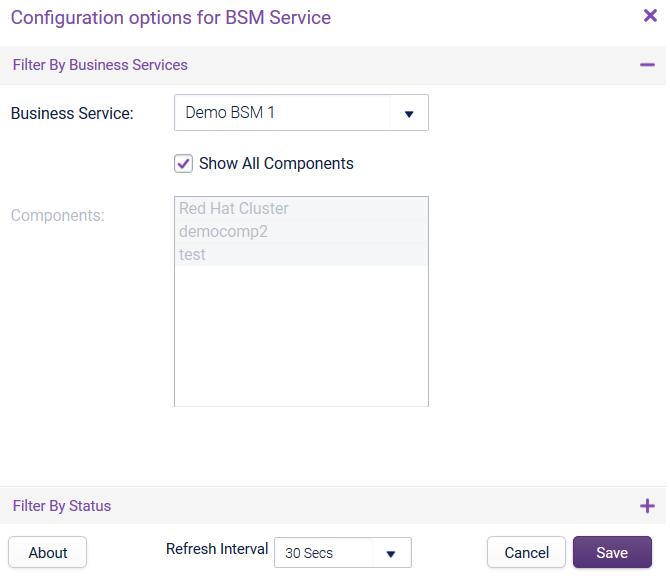
- Filter by Status: Allows you to choose which Components are displayed based on status.
BSM Component Dashlet Copied
The BSM Component dashlet allows you to see the health of a Component, the Hosts within the Component AND the health of all of the Business Services of which the selected Component is a member of:
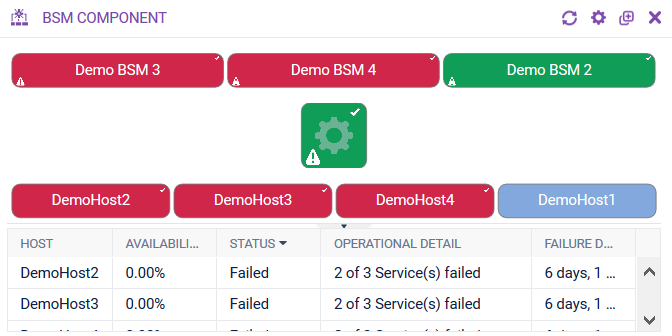
In the example above, you can see a single Component which is operational but ‘impacted’ (i.e. it contains a failed Host, but not enough failed Hosts to breach the ‘required online’ / ‘allowed to fail’ thresholds). You can also see the Hosts within the Component and their health, and also the health of the Business Services that rely upon the Component.
The table contains data relating to the Hosts, such as availability, status (i.e. is one of the Service Checks that is a member of the Host template used to create the Component in a state of CRITICAL), and failure duration (i.e. how long has it been failed).
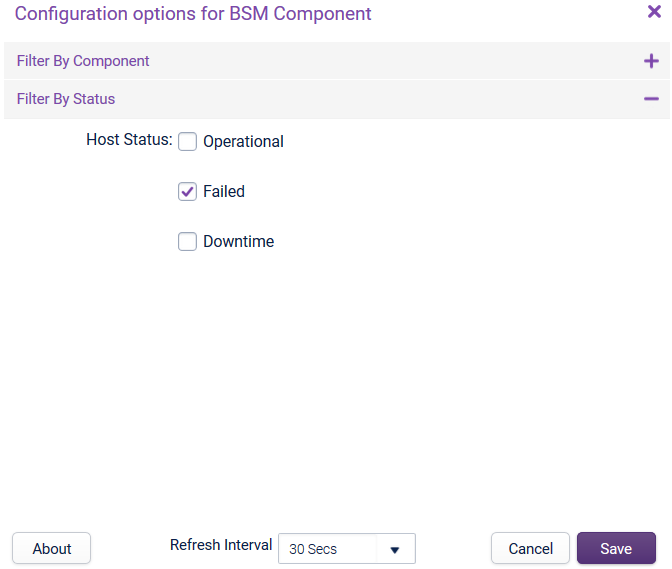
By clicking on the cog at the top right of the dashlet, you can configure what information you would like to be displayed:
- Filter by Component: Here you can choose the Component to display, and also specify which Hosts within the Component are displayed.
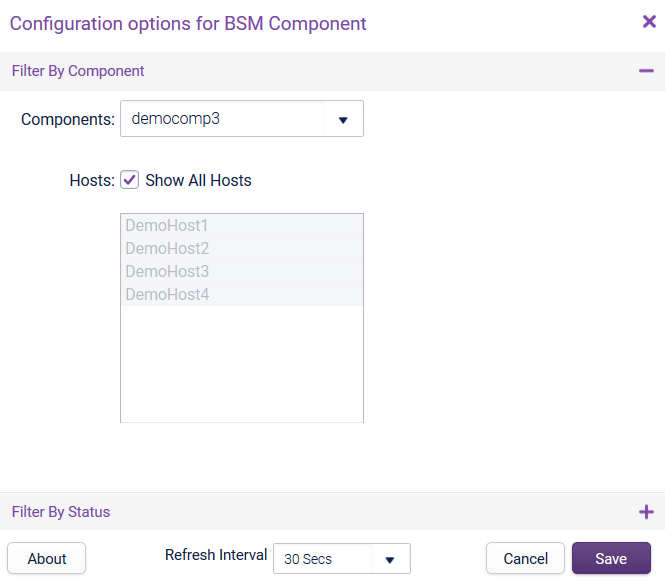
- Filter by Status: Here you can choose to display only certain Hosts with the Component based on status, i.e. only show ‘Failed’ Hosts, etc.
Investigate Mode Copied
On each of the BSM dashlets, you can click on the Business Service, Component or Host, as shown below:
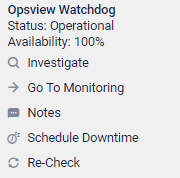
For Business Services and Components you can click on the ‘Investigate’ button which will load a modal investigate window. The concept behind ‘investigate’ is to allow you to spot an offline business service, click on ‘investigate’, and be able to view the end to end Business Service in a modal window, as shown below:
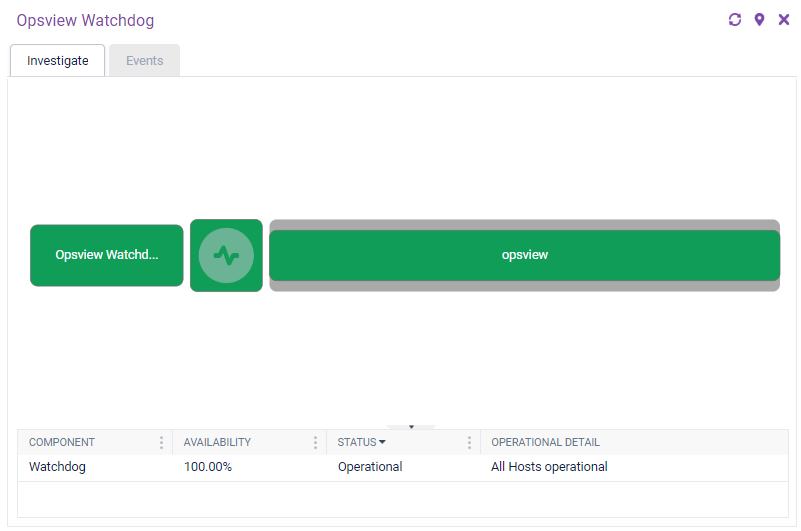
Pinning Copied
The modal views can be ‘pinned’ to the dashboard. This means that instead of manually setting up a new dashlet from scratch with the information available in the modal view, you can use ’the pin’ to automatically add a new dashlet to your current dashboard:

When clicked, the current modal window will be added to the dashboard as a pre-configured dashlet.
Events Copied
The modal window also contains another tab called ‘Events’, which will display the events for the Business Service (and its Components and Hosts), or the Component (and its Hosts), as below:
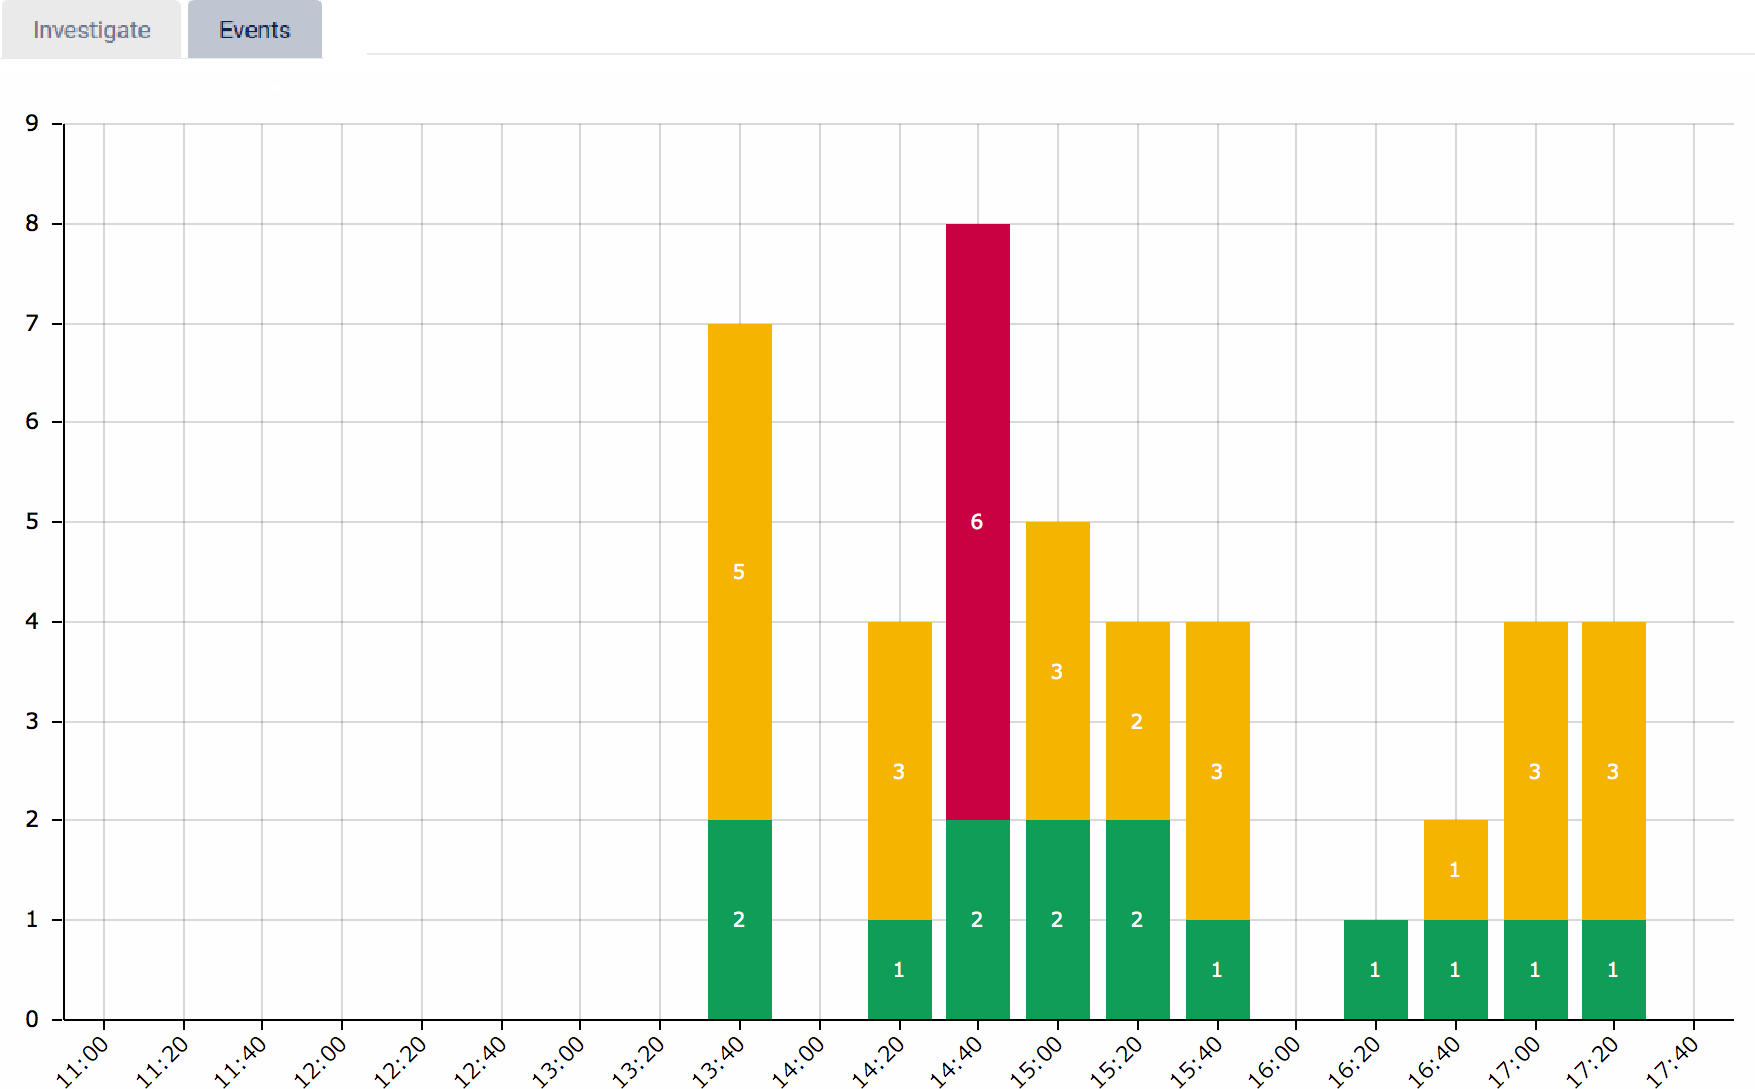
This view can also be pinned to the dashboard as a pre-configured dashlet.