Viewing and canceling downtimes
To get an overview of the downtimes whether scheduled, active, or historical, go to the Monitoring > Scheduled Downtimes page.
Viewing downtimes Copied
Downtimes in the system can be scheduled for either an entire host (including all its services) or for a specific service. Understanding how these are displayed helps you quickly see which components are affected.
Host downtime Copied
When downtime is scheduled for a host, all services associated with that host are included. In the Scheduled Downtimes view, host downtime entries are displayed as nested rows:
- The host itself appears as the parent row.
- Each service affected by the host downtime is listed as a child row beneath the host.
This hierarchical view makes it easy to see at a glance which services are impacted by the host-level downtime.

Service downtime Copied
When downtime is scheduled for an individual service, only that service is affected. These entries appear as single rows in the grid.
This format clearly distinguishes service-specific downtime from host-level downtime.

Live and Historical views Copied
The Downtimes page provides two main views to help you track and manage scheduled downtime: Live View and Historical View.
Live View Copied
By default, the page displays the Live View, which summarizes ongoing downtimes and downtimes scheduled to occur in the future.
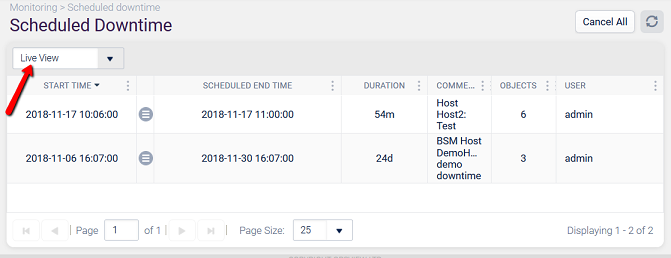
Once a downtime period ends or is cancelled, the record moves to the Historical View.
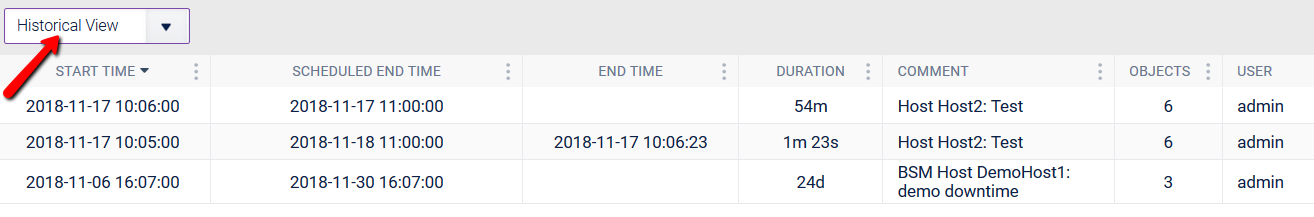
Historical View Copied
The Historical View displays completed or cancelled downtimes for reporting and auditing purposes.
Columns in both views Copied
Both Live View and Historical View include the following columns
- Host — host affected by the downtime.
- Service Check — service check affected by the downtime, or if its a host downtime, the number of service checks of that host that are also affected.
- Start Time — date or timestamp of the beginning of the downtime period.
- Scheduled End Time — date or timestamp of the scheduled end of the downtime period.
- Duration — duration of the downtime - between the start time and the current time.
- Comment — when downtime is scheduled, you must enter a description for it. The comment will appear in this column. You can also filter this column using the grid header menu to search for specific text within the comments.
- User — username of the person who scheduled the downtime. This can also be filtered via the grid header menu to search for a specific string inside usernames.
- End Time (Historical View only) — actual timestamp when the downtime ended.
Searching downtimes Copied
To locate specific downtimes, you can use either keywords or field-based filters:
host:name— filter by host.servicecheck:"service name"— filter by service check.user:username— filter by the user who scheduled the downtime.comment:text— filter by comment text.scheduledstarttime:date— filter by scheduled start time (filters from this time).scheduledendtime:date— filter by scheduled end time (filters up to this time).
If no field is specified, the search defaults to host names. For example:
Tip
Use quotes for any values that contain spaces.
-
opsview— searches all hosts.
-
host:opsview servicecheck:"Connectivity - LAN"— searches a specific host and service check.
In this example, the host downtime also affects the
Connectivity - LANservice check. -
user:admin comment:"router change"— searches by user and comment.
Canceling downtimes Copied
You can cancel any scheduled or currently active downtime:
- Select one or more downtimes from the list.
- Click Cancel.
This immediately ends the selected downtimes and removes them from the Live View.
Warning
Historical downtimes cannot be cancelled, as they have already occurred. They remain in the grid for reporting and audit purposes.
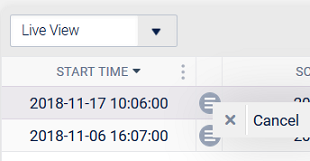
Downtimes can also be cancelled from the context menu.

Classic view Copied
You can access the classic Scheduled Downtime view view by clicking Classic Schedule Downtime, located next to the refresh button in the page toolbar.
