Opsview 6.8.x End of Support
With the release of Opsview 6.11.0 on February 2025, versions 6.8.x have reached their End of Support (EOS) status, according to our Support policy. This means that versions 6.8.x will no longer receive code fixes or security updates.
The documentation for version 6.8.9 and earlier versions will remain accessible for the time being, but it will no longer be updated or receive backports. We strongly recommend upgrading to the latest version of Opsview to ensure continued support and access to the latest features and security enhancements.
Opsview Data Warehouse (ODW)
Overview Copied
The Opsview Data Warehouse, or ODW, is the long term storage for monitoring data. It converts the data from the Runtime database into an OLAP (On Line Analytical Processing) datawarehouse format. When generating reports, the data comes from the Opsview Data Warehouse.
A core requirement for a datawarehouse is to not normalise the data too much, yet still allow queries to be easily created. As you’ll see, hopefully we will have reached this target.
The datawarehouse pulls data in once an hour. It works out if there have been any configuration changes and stores those if required. It then saves various Runtime information before calculating the summary statistics.
Distributed Monitoring Copied
ODW calculates information based on the central Opsview Runtime database. Any Collectors monitoring remote sites will automatically send their information to the Orchestrator which updates the central database, and hence will be captured in ODW as well.
Limitations Copied
Only service information is stored.
References Copied
The datawarehouse has been created based on guidelines in Ralph Kimball’s book, The Data Warehouse Toolkit.
Setup Copied
Go to Configuration > My System and go to the ODW tab to enable ODW importing.
A cron job will run at 4 minutes past every hour to import into ODW.
Note
There is a default servicecheck called Opsview Data Warehouse Status which will alert if the ODW database is not up to date. Set this up so you will be alerted if the imports fall behind more than 2 hours.
Available data Copied
Schema Copied
Services schema Copied
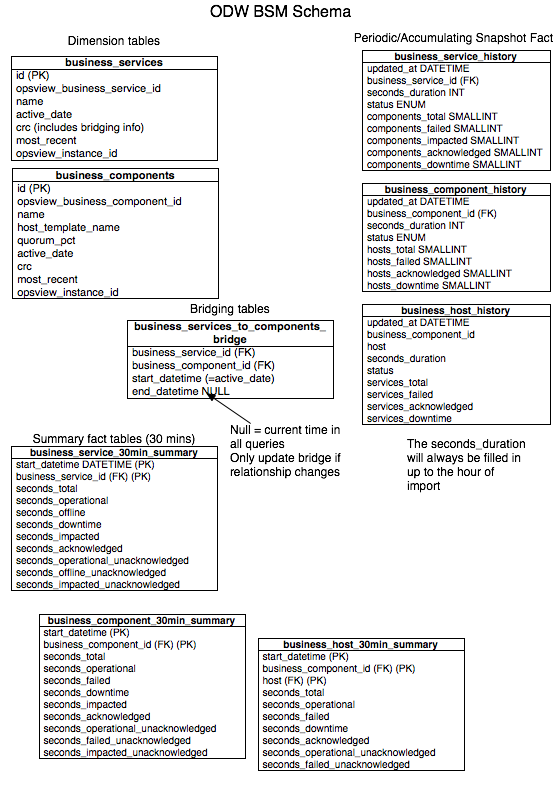
BSM schema Copied
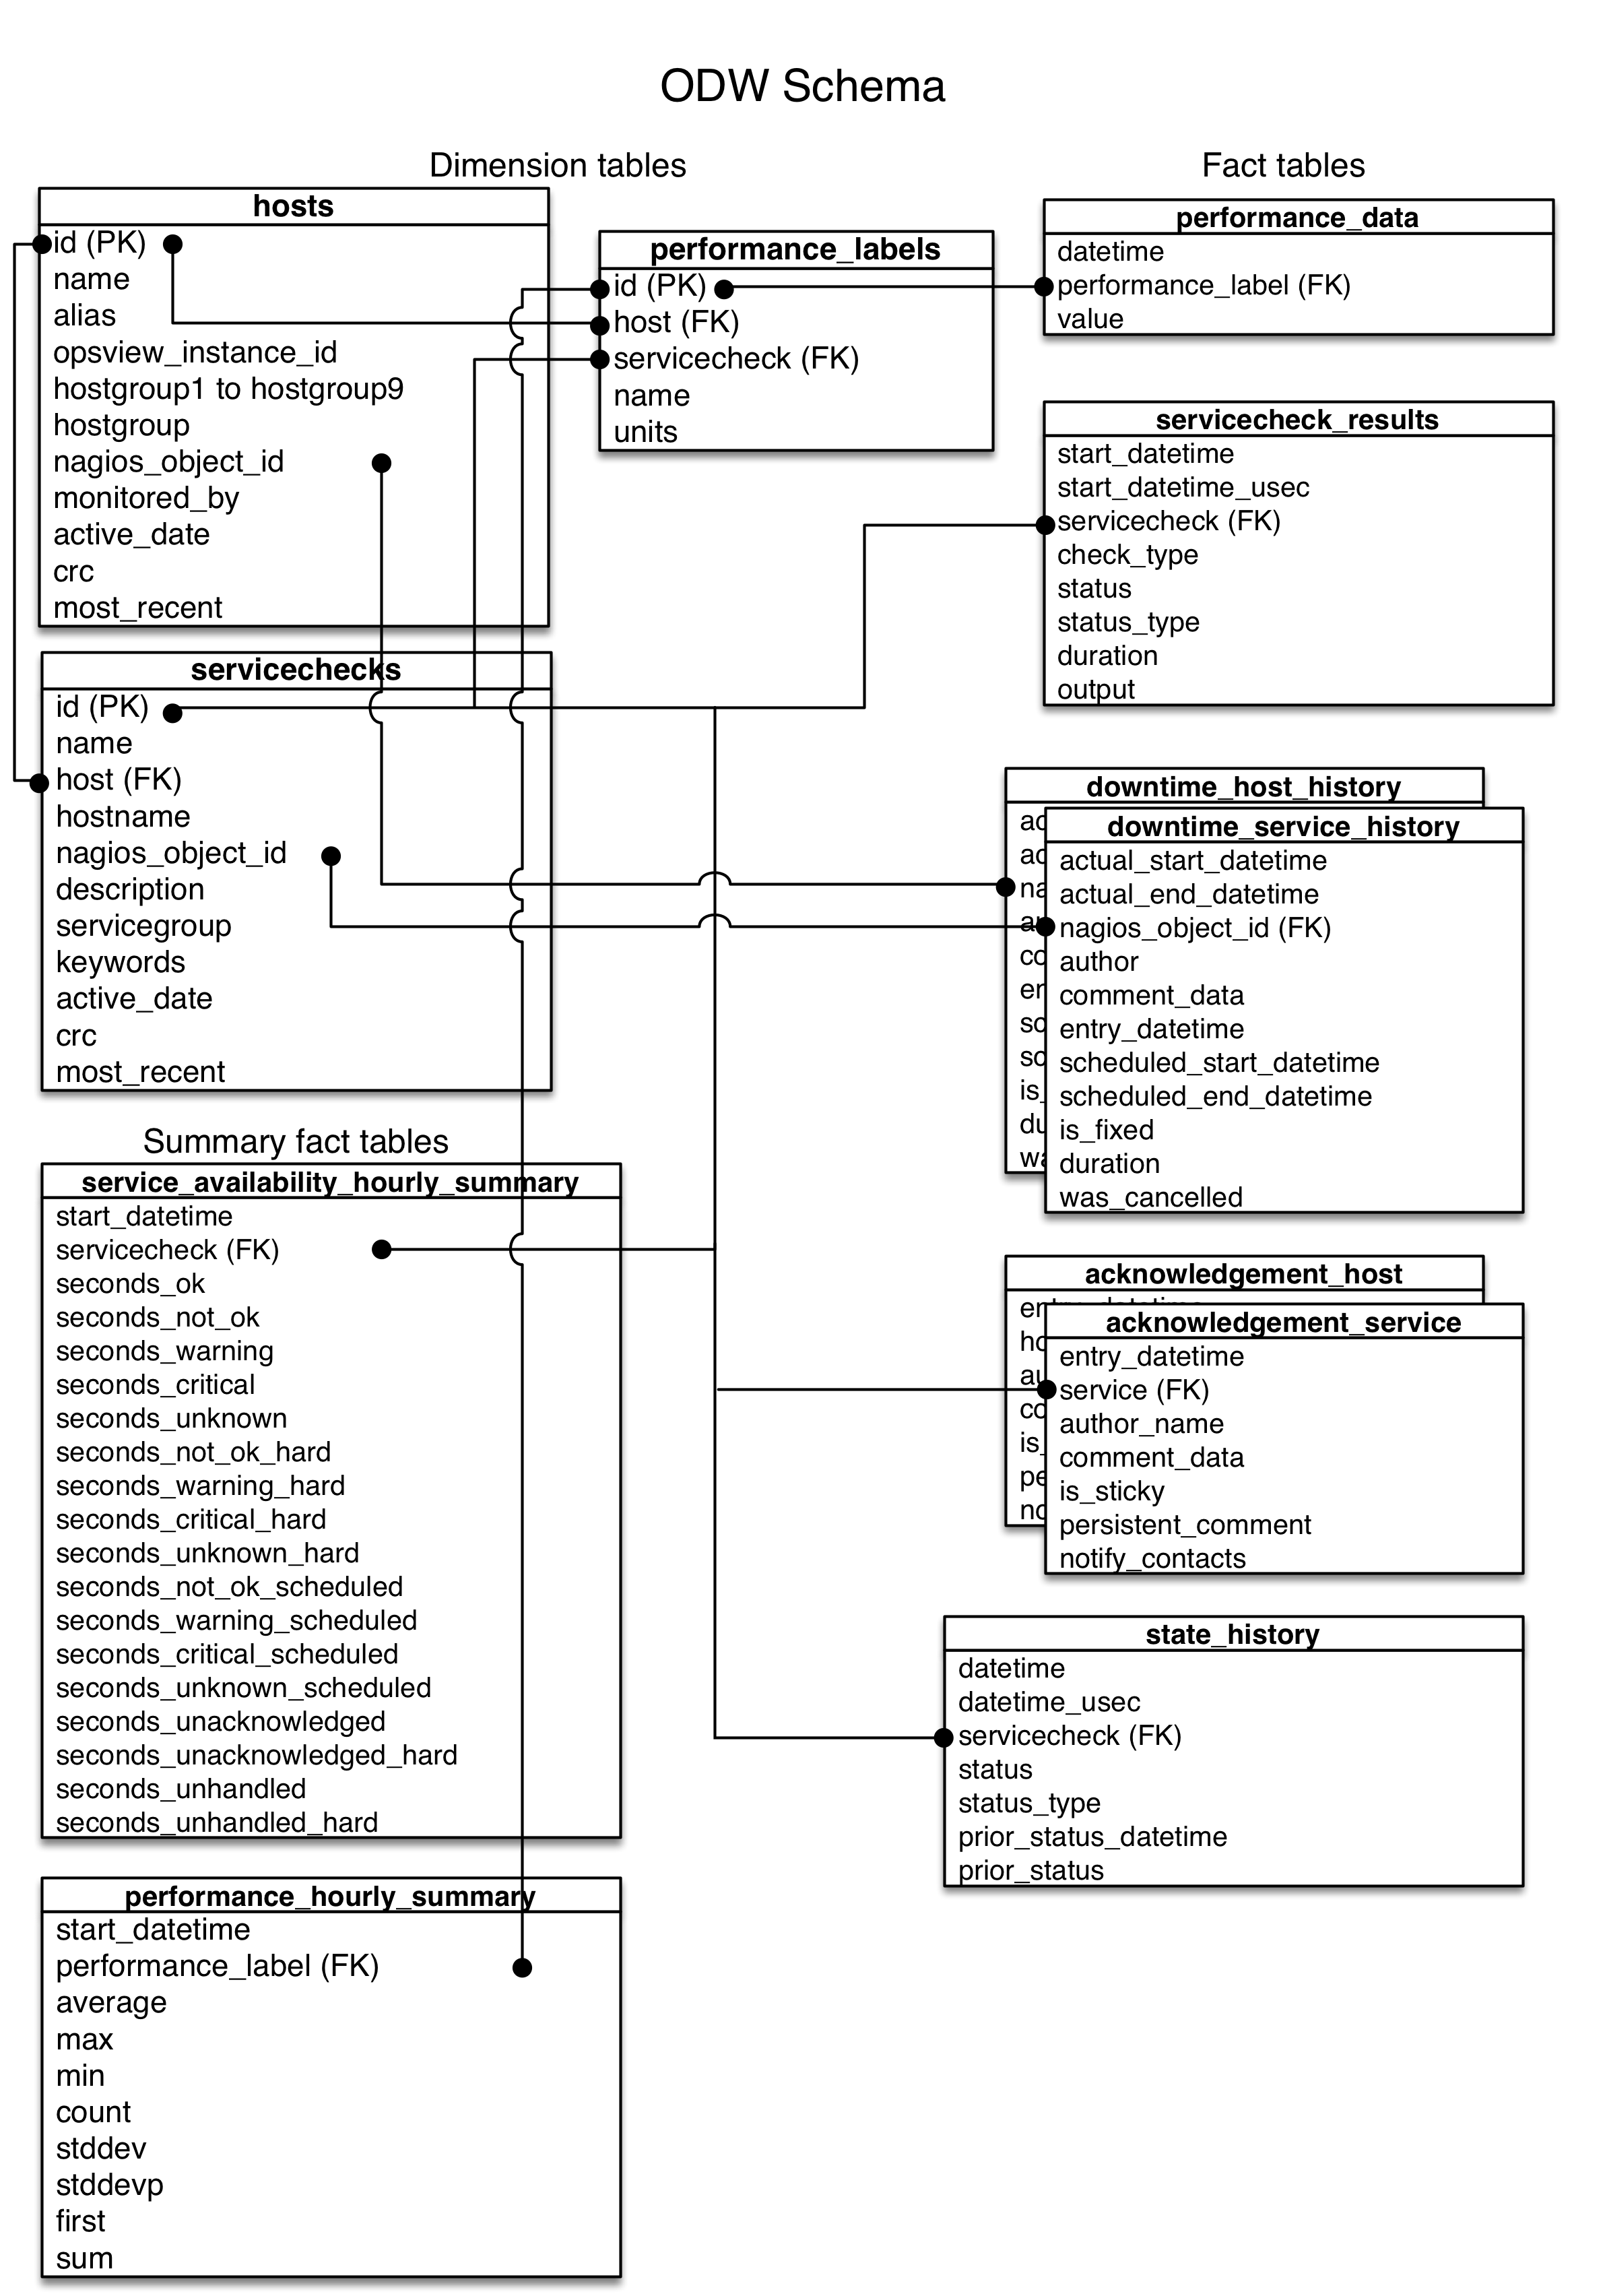
Dimensions Copied
The dimensions are primarily host and servicechecks. As we also store configuration information about hosts and services, there may possibly be more than 1 row for each host/service. When designing your SQL query, make sure you take into consideration that multiple rows could exist and join your tables appropriately.
There is also a performance label dimension. This allows quick querying to find out what performance information is available for a given host.
Facts Copied
These are for core information. There are five tables:
state_history— this shows all the state changes that have occurred for a given service.servicecheck_results— this shows the result of every check from every service.performance_data— this shows every performance result from every service. If you’re only using averages, then use the performance_hourly_summary table instead.downtime_host_history&downtime_service_history— contains all downtimes for all hosts and services.acknowledgement_host&acknowledgement_service— contains all acknowledgements for all hosts and services.
Note
Thedowntime_host_historyanddowntime_service_historytables use the nagios_object_id as the key for the host/service. This is because a downtime is a range of time, so it is possible that a host or service’s configuration could change, thus the key would be different. However, since nagios_object_id is fixed, we key against that instead. Theacknowledgement_hostandacknowledgement_servicetables do not use nagios_object_id because an acknowledgement is at a point in time, so does not have the same problem.
Summary facts Copied
There are two tables:
service_availability_hourly_summaryperformance_hourly_summary
service_availability_hourly_summary Copied
This is an aggregated table, taking information from state_history, downtime_host_history,downtime_service_history, acknowledgement_host and acknowledgement_service to provide numerical information about the number of seconds that a service is in a particular state. This allows quick calculations to discover any problems you might have.
The columns in this table are:
- start_datetime — this is the top of the hour for the summary information.
- seconds_ok — this is total number of seconds that this service was in an okay state.
- seconds_not_ok — normally ok + not_ok = 3600 (not true if a service was started in the middle of an hour).
- seconds_warning — amount of time in a warning state.
- seconds_critical — amount of time in a critical state.
- seconds_unknown — amount of time in an unknown state.
- seconds_not_ok_hard — equivalent to seconds_not_ok, but based on a hard state only.
- seconds_warning_hard — amount of time in a hard warning state.
- seconds_critical_hard — amount of time in a hard critical state.
- seconds_unknown_hard — amount of time in a hard unknown state.
- seconds_not_ok_scheduled — amount of time in a scheduled downtime for host/service and service not ok.
- seconds_warning_scheduled
- seconds_critical_scheduled
- seconds_unknown_scheduled — the summation of warning, critical and unknown will give seconds_not_ok_scheduled.
- seconds_unacknowledged — amount of time after a hard state change before an acknowledgement is received. See notes below about the calculation of seconds_unacknowledged.
- seconds_unhandled — amount of time service was in a failure state and not acknowledged and not in downtime and host was up. See notes below about the calculation of seconds_unhandled.
- seconds_unhandled_hard — amount of time service was in a hard failure state and not acknowledged and not in downtime and host was up.
Take note of the following:
- When first importing, all failures are considered acknowledged.
- Downtimes that start before the first import are ignored.
- Acknowledged and scheduled downtimes are not linked to state because it shouldn’t matter.
- ‘-_soft’ has not been added.
- seconds_not_ok_scheduled is incremented if a downtime is set for a service that is already in a failed state.
- If the host for a service is in a downtime state, then the service will be considered to be in downtime too.
- seconds_unacknowledged starts from the time of a failed hard state.
- If a host is acknowledged, all services on that host will be acknowledged too (if they are in a failed state).
- If a service is acknowledged before it goes into a hard state, seconds_unacknowledged will be = 0 for that particular outage.
- seconds_unacknowledged will not be incremented if a service was in downtime at the time of the hard failure. However, if a service is already in a failed state and is unacknowledged, the seconds_unacknowledged will continue to increment during this downtime period.
- seconds_unacknowledged will start incrementing when a downtime finishes.
- If a service is already in a failed state without being acknowledged and downtime is set, seconds_unacknowledged will include the seconds elapsed during this downtime period. However, this would not be usual operational behaviour.
- To find the amount of time a service has been in critical without a scheduled downtime, use seconds_critical - seconds_critical_scheduled.
- seconds_unhandled counts its time based on events of the service, so acknowledgements, downtime start and downtime stop events on the service will count the time appropriately. However, host state events for the particular service are not included necessarily recorded, so the unhandled calculation maybe too high until a subsequent event occurs for the service.
performance_hourly_summary Copied
This is an aggregated table of the performance data for each performance plot. This allows you to simply get the information over time. The maximum granularity is on an hour basis.
The columns in this table are:
- start_datetime - this is the top of the hour for the summary information.
- performance_label - this joins with the performance_labels table.
- average - the average value over the hour.
- max - the maximum value over the hour.
- min
- count - the number of performance plots in this hour. If there were no plots, there would be no rows.
- stddev - the standard deviation of a sample within the hour. This is the same as Excel’s STDEV function.
- stddevp - the standard deviation of the population within the hour. This is the same as Excel’s STDEVP function.
- first - the first value in the hour.
- sum - the total of all values in that hour.
If you want an average over a day, do not use AVG(average). Use SUM(sum)/SUM(count) instead.
Example queries Copied
Percentage availability for a given day for all services Copied
select sum(seconds_ok)/sum(seconds_ok+seconds_not_ok)*100
from service_availability_hourly_summary
where start_datetime between '2007-11-06 00:00:00' and '2007-11-06 23:00:00'
Percentage of time in error due to hard state Copied
select sum(seconds_not_ok_hard)/sum(seconds_ok+seconds_not_ok)*100
from service_availability_hourly_summary
where start_datetime between '2007-11-06 00:00:00' and '2007-11-06 23:00:00'
Percentage of time in critical state Copied
select sum(seconds_critical)/sum(seconds_ok+seconds_not_ok)*100
from service_availability_hourly_summary
where start_datetime between '2007-11-06 00:00:00' and '2007-11-06 23:00:00'
Percentage availability (excluding scheduled downtimes) Copied
select sum(seconds_not_ok-seconds_not_ok_scheduled)/sum(seconds_ok+seconds_not_ok)*100
from service_availability_hourly_summary
where start_datetime between '2007-11-06 00:00:00' and '2007-11-06 23:00:00'
Percentage availability for all HTTP services during working hours (8am-6pm) Copied
select sum(seconds_ok)/sum(seconds_ok+seconds_not_ok)*100
from service_availability_hourly_summary,servicechecks
where start_datetime between '2007-11-06' and '2007-11-12'
and service_availability_hourly_summary.servicecheck=servicechecks.id
and servicechecks.name = 'HTTP'
and time(start_datetime) between '08:00:00' and '18:00:00'
Average response time to acknowledge failures Copied
select avg(seconds_unacknowledged)
from service_availability_hourly_summary
where start_datetime between '2007-11-06 00:00:00' and '2007-11-06 23:00:00'
and seconds_unacknowledged > 0
Note
You have to ask forseconds_unacknowledge> 0 (which means a failure actually occurred), otherwise it will bring the average down. Also, if a problem automatically recovers, then theseconds_unacknowledgedcounter stops, so this will not always be due to a human response time.
List all services that failed during a scheduled downtime for a given week Copied
select distinct(servicechecks.id),hostname,name
from service_availability_hourly_summary, servicechecks
where service_availability_hourly_summary.servicecheck=servicechecks.id
and start_datetime between '2007-11-06' and '2007-11-12'
and seconds_not_ok_scheduled > 0
List all performance data for a host Copied
select
 performance_data.datetime,
 servicechecks.hostname,
 servicechecks.name,
 performance_labels.name,
 performance_labels.units,
 performance_data.value
from
 servicechecks,
 performance_labels,
 performance_data
where
 servicechecks.id = performance_labels.servicecheck
 and performance_labels.id = performance_data.performance_label
 and performance_data.datetime between '2009-01-01' and '2009-01-02'
 and servicechecks.hostname='opsview'
Note
It is necessary to join against the servicechecks table because the servicechecks.id number will change when there has been a configuration change to the service or its associated host. Searching the servicechecks table via the hostname will ensure that this host’s information will always be returned.
List daily average values for all performance data on a host Copied
There are two ways of calculating this:
- using summary data.
- using raw data.
The summary data takes about a tenth of the time of using the raw data and so we recommend you use the summary tables.
Note also that there maybe slight differences in the values returned between the two calls, but these are rounding errors after 13 significant digits.
Summary data query Copied
Note that the BETWEEN statement is ‘2013-09-11 00:00:00’ AND ‘2013-09-11 23:00:00’ because you will want to include the last hour’s summary data, but not the hour in the following day.
SELECT
 DATE(performance_hourly_summary.start_datetime) AS date,
 servicechecks.hostname,
 servicechecks.name,
 performance_labels.name,
 performance_labels.units,
 SUM(performance_hourly_summary.sum)/SUM(performance_hourly_summary.count) as value
FROM
 servicechecks,
 performance_labels,
 performance_hourly_summary
WHERE
 servicechecks.id = performance_labels.servicecheck
 AND performance_labels.id = performance_hourly_summary.performance_label
 AND performance_hourly_summary.start_datetime BETWEEN '2013-09-11 00:00:00' AND '2013-09-11 23:00:00'
 AND servicechecks.hostname='opsview'
GROUP BY
 servicechecks.hostname,
 servicechecks.name,
 performance_labels.name,
 performance_labels.units,
 DATE(performance_hourly_summary.start_datetime)
Raw data query Copied
Note
This may include a data point that is in the following day due to the behaviour of BETWEEN, eg 2010-09-12 00:00:00.
SELECT
 DATE(performance_data.datetime) AS date,
 servicechecks.hostname,
 servicechecks.name,
 performance_labels.name,
 performance_labels.units,
 AVG(performance_data.value)
FROM
 servicechecks,
 performance_labels,
 performance_data
WHERE
 servicechecks.id = performance_labels.servicecheck
 AND performance_labels.id = performance_data.performance_label
 AND performance_data.datetime BETWEEN '2010-09-11' AND '2010-09-12'
 AND servicechecks.hostname='opsview'
GROUP BY
 servicechecks.hostname,
 servicechecks.name,
 performance_labels.name,
 performance_labels.units,
 DATE(performance_data.datetime)
List daily average and max values for the HTTP response time across all hosts in the last month Copied
SELECT
 DATE(performance_hourly_summary.start_datetime) AS date,
 servicechecks.hostname,
 performance_labels.name,
 SUM(sum)/SUM(count) AS average,
 MAX(max) AS max
FROM
 servicechecks,
 performance_labels,
 performance_hourly_summary
WHERE
 servicechecks.id = performance_labels.servicecheck
 AND performance_labels.id = performance_hourly_summary.performance_label
 AND performance_hourly_summary.start_datetime BETWEEN DATE(NOW()-INTERVAL 1 MONTH) AND DATE(NOW())-INTERVAL 1 HOUR
 AND servicechecks.name='HTTP'
 AND performance_labels.name='time'
GROUP BY
 servicechecks.hostname,
 performance_labels.units,
 DATE(performance_hourly_summary.start_datetime)
This query uses the summarised performance data table which is much faster (and can be held for much longer) than the raw data table.
List all service state changes for a particular servicegroup that occurred yesterday Copied
Order by hostname, servicename, so you can see state changes for that service over the time period.
select
 servicechecks.hostname,
 servicechecks.name,
 state_history.datetime,
 state_history.status,
 state_history.output
from
 state_history,
 servicechecks
where
 state_history.datetime between '2008-12-02 00:00:00' and '2008-12-03 00:00:00'
 and state_history.servicecheck = servicechecks.id
 and servicechecks.servicegroup = 'Operations'
order by
 servicechecks.hostname,
 servicechecks.name
Unix disk usage for a specific host Copied
List disks and show MB used and percent used for each filesystem:
SELECT
 start_datetime,
 performance_labels.name,
 AVG(case performance_labels.units when 'MB' then average else null end) 'MB used',
 AVG(case performance_labels.units when '' then average else null end) '% used'
FROM
 performance_hourly_summary,
 performance_labels,
 servicechecks
WHERE
 performance_labels.servicecheck=servicechecks.id
 AND performance_labels.id=performance_hourly_summary.performance_label
 AND servicechecks.hostname='opsview'
 AND servicechecks.name LIKE 'Unix disk:%'
GROUP BY
 start_datetime,
 servicechecks.name
ORDER BY
 start_datetime DESC
LIMIT 10;
+---------------------+----------------+------------------+------------------+
| start_datetime      | name           | MB used          | % used           |
+---------------------+----------------+------------------+------------------+
| 2013-01-03 19:00:00 | /              | 3548.08333333333 | 88.0191666666666 |
| 2013-01-03 19:00:00 | /mnt/tmpfs     |               24 |               96 |
| 2013-01-03 19:00:00 | /var/lib/mysql |            39526 |            92.48 |
| 2013-01-03 18:00:00 | /              |             3546 |          87.9675 |
| 2013-01-03 18:00:00 | /mnt/tmpfs     |               24 |               96 |
| 2013-01-03 18:00:00 | /var/lib/mysql | 39525.0833333333 |          92.4775 |
| 2013-01-03 17:00:00 | /              | 3543.91666666667 |           87.915 |
| 2013-01-03 17:00:00 | /mnt/tmpfs     |               24 |               96 |
| 2013-01-03 17:00:00 | /var/lib/mysql |            39524 |            92.47 |
| 2013-01-03 16:00:00 | /              |           3541.5 |           87.855 |
+---------------------+----------------+------------------+------------------+
10 rows in set (0.50 sec)
Windows disk usage for a specific host Copied
List disks and show GB used and percent used for each filesystem:
SELECT
 start_datetime,
 performance_labels.name,
 AVG(case performance_labels.units when 'G' then average else null end) 'G used',
 AVG(case performance_labels.units when '%' then average else null end) '% used'
FROM
 performance_hourly_summary,
 performance_labels,
 servicechecks
WHERE
 performance_labels.servicecheck=servicechecks.id
 AND performance_labels.id=performance_hourly_summary.performance_label
 AND servicechecks.hostname='windows'
 AND servicechecks.name LIKE 'C Drive'
GROUP BY
 start_datetime,
 servicechecks.name
ORDER BY
 start_datetime DESC
LIMIT 10;
+---------------------+------+---------+--------+
| start_datetime      | name | GB used | % used |
+---------------------+------+---------+--------+
| 2012-11-23 14:00:00 | C: % |   32.31 |     54 |
| 2012-11-23 13:00:00 | C: % |   32.31 |     54 |
| 2012-11-23 12:00:00 | C: % |   32.31 |     54 |
| 2012-11-23 11:00:00 | C: % |   32.31 |     54 |
| 2012-11-23 10:00:00 | C: % |   32.31 |     54 |
| 2012-11-23 09:00:00 | C: % |   32.31 |     54 |
| 2012-11-23 08:00:00 | C: % |   32.31 |     54 |
| 2012-11-23 07:00:00 | C: % |   32.31 |     54 |
| 2012-11-23 06:00:00 | C: % |   32.31 |     54 |
| 2012-11-23 05:00:00 | C: % |   32.31 |     54 |
+---------------------+------+---------+--------+
10 rows in set (0.04 sec)
Frequently asked questions Copied
How come it is sometimes “servicecheck” and other times “service”? Copied
Unfortunately, this is a historical problem and would be difficult to correct without aliasing of table and column names. We’ve have now made sure our terminology is correct, so new work should be consistently named.
How are timezones stored? Copied
All data in ODW is stored using UTC, not the local time of the server, so no timezone information is stored.
How can I ensure timezones are calculated correctly? Copied
If you access ODW using the Opsview libraries (Odw.pm or Odw::Schema), then the timezone for the session is switched to UTC automatically.
If you access ODW from a mysql command line, you can either set the session timezone to be UTC with: set time_zone='+00:00' or make the conversions as part of the input:
- use
CONVERT_TZ(datetime, @@session.time_zone, '+00:00')to convert to UTC when inputting date ranges. - use
CONVERT_TZ(datetime, '+00:00', @@session.time_zone)to convert from UTC when displaying times.
How long does a dataload take? Copied
This information is stored in the dataloads table. You can see when the data load time for a particular hour period was made:
select
 from_unixtime(period_start_timev) as period_top_of_hour,
 from_unixtime(load_start_timev) as load_start_time,
 load_end_timev-load_start_timev as duration
from dataloads
order by id desc
limit 10
Can I see the trends of previous data loads? Copied
Run this query:
select
 from_unixtime(period_start_timev),
 from_unixtime(load_start_timev),
 duration,
 num_serviceresults
from dataloads
order by id desc
limit 100
This will show the start of the hour period being imported, when the import took place, the duration and the number of serviceresults that were imported.
I get a service result with “ODW_STATUS WARNING - No update since: ….” Copied
This is from the check_odw_status plugin. It means the ODW import job is falling behind.
If there was a failure, see the next section.
If this is because your data loads are taking more than an hour to run (see above for a query to show the time taken), then one thing you can do is to change the cron entry for import_runtime to only run once per day. This has the effect of doing a lookup only once in the first hour’s import and subsequent hours will import much quicker as lookups are not required.
Take note of the following:
- the crontab will be overwritten as part of an upgrade,
- you should change the parameters to the check_odw_status plugin so the threshold for alerting on ODW imports is for 25 hours,
- configuration changes for hosts and services will only be recorded when the import runs,
I get an error “There are running dataloads existing” from import_runtime Copied
This means that a new dataload has run, but the last one hasn’t completed yet. This can also occur if, say, a server shutdown was initiated during the last dataload causing an incomplete dataload to occur.
There needs to be manual intervention to check:
- that there is not an existing dataload running.
- that there is a row in the dataloads table with a status of running.
The fix depends how far back the last successful import was. Use the check_odw_status plugin to print the last import time, or run the query:
mysql> use odw;
mysql> select from_unixtime(period_start_timev),status from odw.dataloads order by id desc limit 1;
+-----------------------------------+---------+
| from_unixtime(period_start_timev) | status  |
+-----------------------------------+---------+
| 2009-02-05 10:00:00               | running |
+-----------------------------------+---------+
1 row in set (0.00 sec)
If there is definitely no import_runtime process running, then continue with the cleanup. This could have occurred if, for instance, the server was rebooted during the import process. Check for the import_runtime process with:
ps -ef | grep import_runtime | grep -v grep
Note
When you cleanup the last import (detailed below), be aware that some data cannot be reverted completely, such as the end time for downtime_service_history and downtime_host_history.
If the pid of the last import no longer exists, then it is assumed that the last import failed and an automatic cleanup of the database is run and the import should continue.
Last import was within a week Copied
As Runtime holds servicecheck results for a week, you can just get the import to continue from the last point
- manually run:
/opt/opsview/coreutils/bin/cleanup_import. This will delete rows related to the failed dataload. - manually run:
/opt/opsview/coreutils/bin/import_runtime -i 1. This will import one hours worth of data - there could be other errors, such as crashed tables. - manually run:
/opt/opsview/coreutils/bin/import_runtimeor leave the cron job to run. This will import up to current time.
Last import was over a week ago Copied
If the last import was a very long time ago, but you want the statistical data, you can do the steps from above but note:
- service check results are discarded after a week, so the import script will not be able to import every check result.
- performance data is stored within the service check results in runtime, so those will be lost too.
- other data (downtimes, service state changes) are retained in runtime up to the audit log retention period (default 365 days), so will still be imported correctly as long as that data hasn’t been pruned. The state changes tables determine the calculations for the
service_availability_hourly_summarytable.
If you do not want statistical data between the last import and a recent date, you can restart the import from a different point.
- Run the cleanup script manually:
/opt/opsview/coreutils/bin/cleanup_import. - Run a single import, giving a restart time:
/opt/opsview/coreutils/bin/import_runtime -i 1 -r '2008-10-31 09'.
If this works successfully, then you can run import_runtime without the -i option which will cause it to catchup to current time (or you could leave for the next cron job).
I get an error ‘Last update to DB is YYYY-MM-DD HH:MM:SS. Cannot run until after YYYY-MM-DD HH:MM:SS’ but the run after date has already past Copied
This has been seen in testing where the runtime.nagios_programstatus table was holding multiple rows. This table should only ever have 1 row. To fix it, ensure the Opsview daemons are shut down:
/etc/init.d/opsview stop
and then run the following MySQL queries against the runtime database:
mysql> delete from runtime.nagios_instances where instance_id != 1;
mysql> delete from runtime.nagios_programstatus where instance_id != 1;
Then restart Opsview:
/etc/init.d/opsview start
I get the error message “Upgrade in progress” Copied
This is due to a lock file that is added during a package installation to disable the ODW imports from running. If you are sure that an upgrade is not in progress, then you can remove the lock file from /opt/opsview/coreutils/var/upgrade.lock.
How do I change the data in ODW? Copied
If state change data has not got into the Runtime database, then the ODW will not know about these state changes either. If you need to change the state of a service into a, say, OK state, you need to follow this process:
- Identify the service id:
select id from servicechecks where name='SERVICECHECKNAME' and hostname='HOSTNAME'. - Change any values of the appropriate values in
service_availability_hourly_summary. - Update the
service_saved_statetable so that the last recorded state is correct. This ensures the right state is calculated for the next hour.