Opsview 6.8.x End of Support
With the release of Opsview 6.11.0 on February 2025, versions 6.8.x have reached their End of Support (EOS) status, according to our Support policy. This means that versions 6.8.x will no longer receive code fixes or security updates.
The documentation for version 6.8.9 and earlier versions will remain accessible for the time being, but it will no longer be updated or receive backports. We strongly recommend upgrading to the latest version of Opsview to ensure continued support and access to the latest features and security enhancements.
Service Checks, Service Groups and Host Templates
Overview Copied
This section provides an overview of Service Checks, Service Groups and Host templates, how they interact, how to add and configure them, and how to analyze the Service Check data returned. This document will explain to readers the concept of service groups, Service Checks and Host templates, how the three interact, how to create them, how to apply them and finally how to analyze the gathered data.
After reading the User Guide, you should be able to create your own Service Checks, add them to Service Groups or Host templates and then apply the gathered data within the Navigator.
Opsview Monitor uses the concept of Hosts to define a device, server, website, database or more. As covered in Host Groups & Hosts Overview, Hosts are defined as an autonomous computing device, such as (but not limited to), a server, virtual server, a collector server, database server, workstation, PC, network device, storage device, sensor, tablet or mobile device.’ Essentially a host is logical endpoint, meaning a host could be your VMware host, your Oracle database, a Cisco switch or more. It is very flexible.
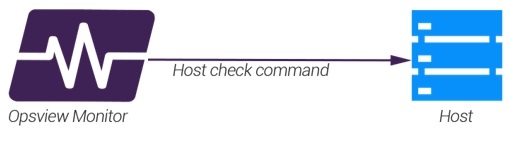
Go to this page for more information on Host Check Commands.
This is good practice and provides an insight into the status of the Hosts in your environment, i.e. all my servers are responding, but what if you want to know information about the Hosts ’ i.e. how busy is the Apache server, how much disk space does my database server have, etc. This additional information is known as services, and as such a User must use a Service Check to gather the data and display it within Opsview Monitor’s analytical views.
Service Checks can be one of four types:
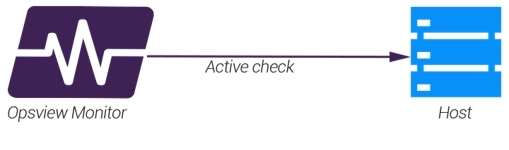
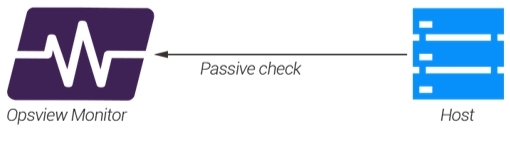
The first two, SNMP Polling and Plugins, are both ‘active checks’. The latter two are referred to as ‘passive checks’. The difference between the two is that active checks are configured to go to the Host (from Opsview Monitor) and ask for information at predetermined, regular intervals ’ whereas passive checks are configured in a way that Opsview Monitor will do nothing unless the monitored host or service sends data into it.
Active check Copied
Active checks mean that the monitoring of a Service Check has been initiated by Opsview Monitor; this means that a check interval has been hit (i.e. five minutes has elapsed) and the Opsview Monitor software uses the determined plugin and arguments OR SNMP OID to retrieve data from the host. The data is then stored, analyzed and actioned if need be (notification sent, status changed, etc).
Passive Check Copied
With passive checks such as SNMP traps or a Passive Check (i.e. NSCA), Opsview Monitor does not have a check interval which it uses to determine when to regularly monitor a Host. This puts the onus on the monitored Host to tell Opsview Monitor when a problem has occurred, i.e. ‘An interface has gone down’ or ‘I’m running out of disk space’. On receiving these messages, Opsview Monitor will store them and then action them again changing a status, sending Notifications and more.
The main benefit of a passive check is that it removes the constant ‘Opsview: Are you ok? ‘Host: Yes I’m fine’, ‘Opsview: How about now?’ ‘Host: Yes I’m fine’ messages.
However, Passive Checks can be tricky to configure and as passive checks are normally monitored purely on a status level and not a performance level ’ in terms of there is no historical data to analyze as the metrics are not being gathered at a regular interval, i.e. with active checks, we are asking the host every 30 seconds ‘how busy are you?’ and it is providing us load average metrics. With a passive check, we will receive no data until the host tells us ‘Hey, I’m really busy’, this means that we cannot use graphs, historical analysis etc on that Host, unless the Host is sending the passive results regularly (much like an active check.)
To summarize, Service Checks allow Opsview Monitor to go deeper than ‘Are you up?’ monitoring, and allows you the ability to get real world metrics on their Hosts, such as load, active requests, network throughput and more ’ data that can be used in various ways throughout Opsview Monitor. In the coming sections, we will cover the different types of Service Checks, how they work and how to configure them.
Check Results Behavior Copied
Temporary Check Failures - Soft and Hard States Copied
To cater for a chance that a result of the active Service Check may temporarily return incorrect results, Opsview Monitor 6 provides a configuration option to re-try the check. If the Max Check Attempts (N) is greater than 1 then any state change has to be confirmed that many times, thus reducing the risk of false alarms. In practice it means the object will remain in Soft state, until the same results are returned N many times by the plugin. The Nth result will be considered as state confirmation and that state will be upgraded to Hard state.
Objects in Soft state while are recorded in database and visible in UI but do not trigger notifications. To avoid a situation that a temporary failure will remain visible but not acted upon any requests for re-check will continue to be verified until state is confirmed. This also covers the scenario when a temporary failure occurred just before the end of Check Period - object will continue to be re-checked until the state is confirmed.
Note
The state is confirmed (via soft states) only if the subsequent check result produces state different that the current hard state.
The above changes are in stark contrast with Opsview 5 which would stop verifying state the of the Object if one of the results seem to return OK/UP and the last Nth state was always considered final.
To disable the Soft states set the Max Check Attempts to 1 and all results will be considered final and objects will be in Hard state. This is the default setting for Passive service checks and SNMP Traps.
Flapping Objects Copied
In addition to Soft states, Opsview 6 also provides a way detecting when objects state changes too often. You can choose to be notified when the flapping has been detected and when the object got stable again. During this period all notifications are suppressed.
Notifications for Flapping starting and stopping will not be sent when notifications are suppressed (such as when acknowledged or in downtime) or when flapping started during downtime but continues after downtime ends.
Handling Host Failures Copied
When the host failure is detected and confirmed Opsview automatically sets all services on that host into UNKNOWN state. Those services will not be checked until host recovers. When it does recover, all services will be automatically and instantly re-checked. Passive checks will continue to be accepted as they only conceptually attached to the host.
Note
At any time, users of Opsview can request both the host and its services to be rechecked.
Host Check On-Demand Copied
Rather than checking the state of a host at regular intervals, you may choose to check the state of host only if one of its Service Checks fails - this is called a Host Check On-Demand. Enable this by setting a check interval of 0 - see the Host documentation for more details.
Note
If Host is checked on-demand and the Host Check indicates that Host is DOWN, then by default the checks will stop being executed. To avoid the scenario in which the host would never recover the Retry Interval is used to automatically actively check the state of the Host. Once the host has recovered and therefore the services are now checked again, we revert to on-demand checking.
Host Assumed Up Copied
The host itself may not represent the physical machine but a virtual collection of Service Checks. In that case as a Host Check Command you can choose Always Assumed UP.
Freshness Checking Copied
For all results, you may want to check that you are getting results within a certain time frame. If no result is received then you can configure a specific action. You can enable freshness checking within the Advanced section of the check where you can submit either an OK result (which can be used to reset a check back to OK, such as 30 minutes after a warning or critical SNMP Trap has been received) or a non-OK result (such as no heartbeat has been received by a Passive Check).
The three configuration options for Freshness Checking are timeout, status, text:
Timeout
This is the amount of time before Opsview Monitor considers a service to be not fresh. You can enter this value in a duration format, such as 10m for 10 minutes or 48h 15m for 48 hours and 15 minutes. If Freshness Timeout is set to 0 the freshness is calculated based on:
- the last time the check was updated;
- the status of the last result;
- service check latency;
- additional latency set on the configuration.
The algorithm used is as follows:
IF SCC.stale_threshold_seconds == 0
  IF SCR.current_state == STATE_OK
    freshness_threshold = SCC.check_interval + SCR.latency + CONFIG.additional_freshness_latency;
  ELSE
    freshness_threshold = SCC.retry_check_interval + SCR.latency + CONFIG.additional_freshness_latency;
ELSE
  freshness_threshold = SCC.stale_threshold_seconds;
END
Where:
- SCC: service check configuration
- SCR: service check latest results
- CONFIG: freshness-checker configuration
- additional_freshness_latency: configuration option with default value of 1800 (seconds) in freshness-checker component
- check_interval: configuration option with default value of 60 (seconds) in freshness-checker component
Status
The check status to submit when the freshness timeout has been reached
Text
The text to populate in the Status Info field to accompany the Status above.