If you are currently using version 5.x.x, we advise you to upgrade to the latest version before the EOL date. You can find the latest documentation here.
RabbitMQ Monitoring Technical Reference
Overview
RabbitMQ is an open source message broker that supports multiple messaging protocols. It is a message querying library used to communicate in scalable distributed systems.
The RabbitMQ integration provides a Gateway configuration file that enables monitoring of RabbitMQ environment through a set of pre-configured Toolkit samplers.
This technical reference provides information on the metrics and dataviews for the samplers available through the RabbitMQ monitoring integration. If you are setting up the integration for the first time, see the RabbitMQ Monitoring User Guide.
Intended audience
This technical reference is intended for users who are monitoring data from the RabbitMQ environment. If you are setting up the integration for the first time, see the RabbitMQ Monitoring User Guide.
Environment variables
The rabbitmqMonitoring.xml script provides the variables that are set in the Environments section. These are configured to ensure that the integration monitors your target RabbitMQ environment.
| Variable | Type | Description |
|---|---|---|
| PYTHON_PATH | String | Path of the Python library located on the machine where the Netprobeis running. |
| RABBITMQ_SCRIPT | String |
Python script for listing out RabbitMQ information. |
| RABBITMQ_SAMPLE | Integer | Frequency of sampling. If checks are executed manually, the value is shown as 0. |
| RABBITMQ_LABEL | String | Used to assign a name to a group of samplers. |
| RABBITMQ_SERVER | String | Host and port to your RabbitMQ server. Note: Do not include |
| RABBITMQ_USER | String | Username that is used with RabbitMQ. |
| RABBITMQ_PASS | String | Password that is used with RabbitMQ username. |
You can also use environment variables when configuring the samplers. The available environment variables are:
| Variable | Type | Description |
|---|---|---|
| GET_MQ_VHOSTS | Boolean | Gets a list of virtual hosts and their properties. |
| GET_MQ_NODES | Boolean | Gets a list of nodes and their properties. |
| GET_MQ_OVERVIEW | Boolean | A high-level overview of your RabbitMQ environment. |
| GET_MQ_EXCHANGES | Boolean | Gets a list of exchanges and their properties. |
| GET_MQ_QUEUES_INFO | Boolean | Gets a list of queues and their metadata. |
| GET_MQ_QUEUES_STATS | Boolean | Gets a list of queues and their performance, and health statistics. |
Metrics and dataviews
The RabbitMQ monitoring integration provides a number of samplers each with a default dataview. The sections below show example dataviews.
Note: Your access to the dataviews in Geneos depends on your permission levels in RabbitMQ. If you do not have permission to view a certain pod, you will not see applicable dataviews in Active Console.
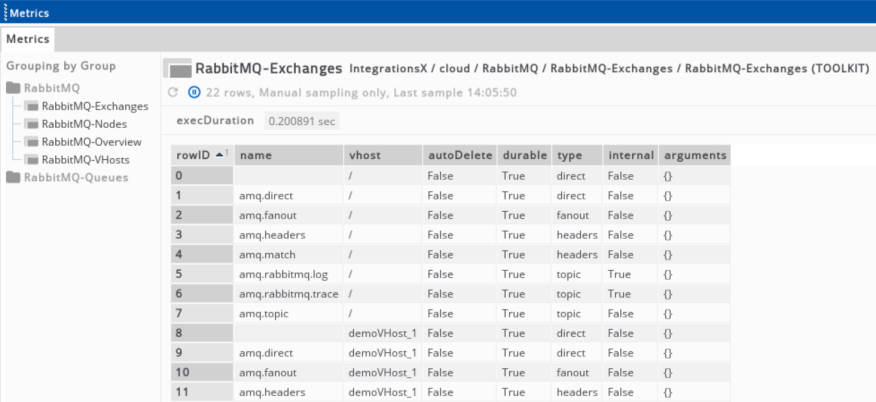
RabbitMQ-Exchanges
This sampler displays a list of exchanges and their properties.
| Headline field | Description |
|---|---|
| execDuration |
Elapsed time for the Toolkit plug-in to run the script. Unit: seconds |
| Column Name | Description |
|---|---|
| name | Name of the RabbitMQ exchange. |
| vhost | Indicates which virtual host the exchange belongs to. |
| autoDelete | Indicates if the queue gets automatically deleted when all consumers have finished using it. |
| durable | Indicates if the exchange is configured with a parameter durable. |
| type | Type of the exchange. Available types are: direct, default, topic, fanout, headers and dead letter exchange. |
| internal | Indicates if an event is internal. |
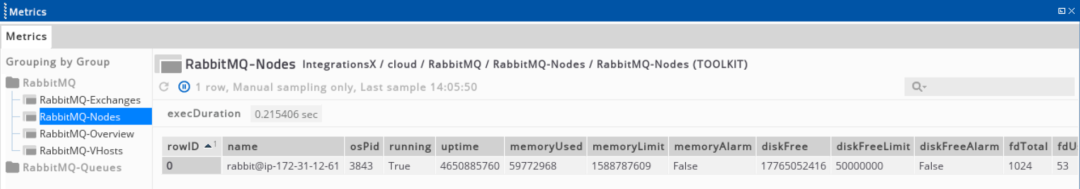
RabbitMQ-Nodes
This sampler retrieves a list of nodes and metadata statistics for the individual nodes.
| Headline field | Description |
|---|---|
| execDuration |
Elapsed time for the Toolkit plug-in to run the script. Unit: seconds |
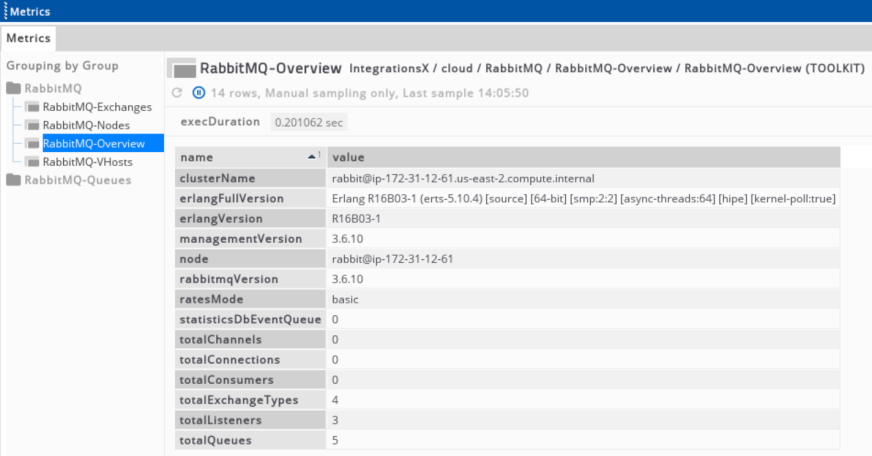
RabbitMQ-Overview
This sampler displays the high level overview of the RabbitMQ environment.
| Headline field | Description |
|---|---|
| execDuration |
Elapsed time for the Toolkit plug-in to run the script. Unit: seconds |
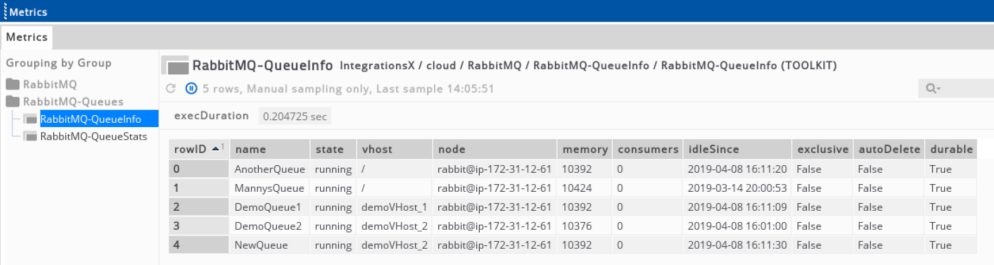
RabbitMQ-QueueInfo
This sampler displays a list of queues and metadata statistics for those queues.
| Headline field | Description |
|---|---|
| execDuration |
Elapsed time for the Toolkit plug-in to run the script. Unit: seconds |
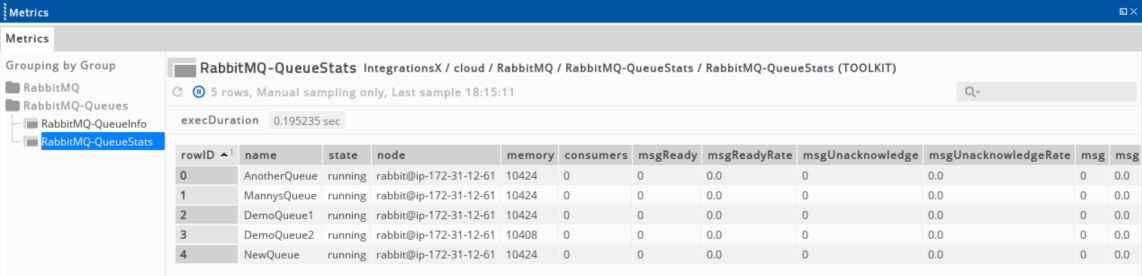
RabbitMQ-QueueStats
This sampler displays a list of queues and usage statistics for those queues.
| Headline field | Description |
|---|---|
| execDuration |
Elapsed time for the Toolkit plug-in to run the script. Unit: seconds |
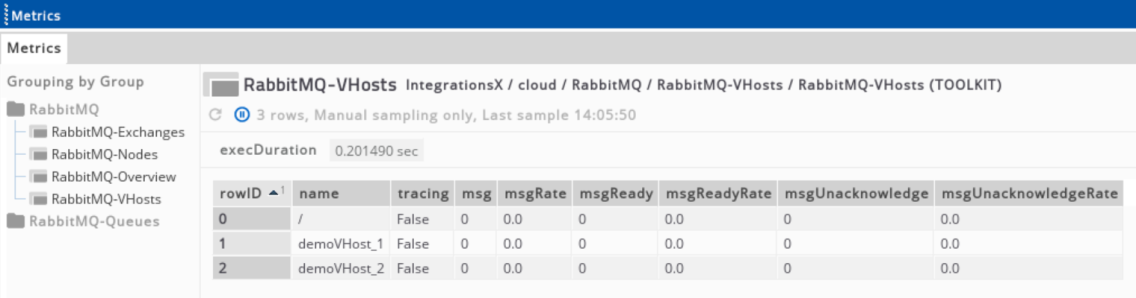
RabbitMQ-VHosts
This sampler displays a list of virtual hosts (vhosts) and metadata statistics for those virtual hosts.
| Headline field | Description |
|---|---|
| execDuration |
Elapsed time for the Toolkit plug-in to run the script. Unit: seconds |
Further reading
To learn more about setting up the RabbitMQ monitoring samplers on a Gateway, see the RabbitMQ Monitoring User Guide.