If you are currently using version 5.x.x, we advise you to upgrade to the latest version before the EOL date. You can find the latest documentation here.
PostgreSQL Monitoring Technical Reference
Overview
PostgreSQL monitoring is a Gateway configuration file that enables monitoring of PostgreSQL database installation through the SQL Toolkit plug-in.
This integration template allows monitoring of queries, views, triggers in the Gateway set-up, and other server activities, such as:
- Tracking of command being executed in the server.
- Monitoring of information about table and index dataview.
- Permits user-defined functions.
Intended audience
This technical reference is intended for users who will be using Active Console to monitor data from PostgreSQL. If you are setting up the integration for the first time, see PostgreSQL Monitoring User Guide.
Metrics and dataviews
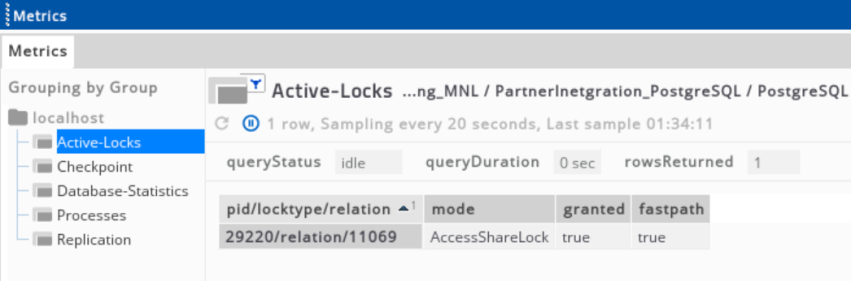
Active locks
| Column Name | Description |
|---|---|
| pid/lockType/relation | Lock information held by active processes in the database server. |
| mode | Refers to the name of the lock mode held by active processes. |
| granted | Set to True if lock was held, or to False if lock was awaited. |
| fastpath | Set to True if lock was taken via fast path, or to False if taken via main lock table. |
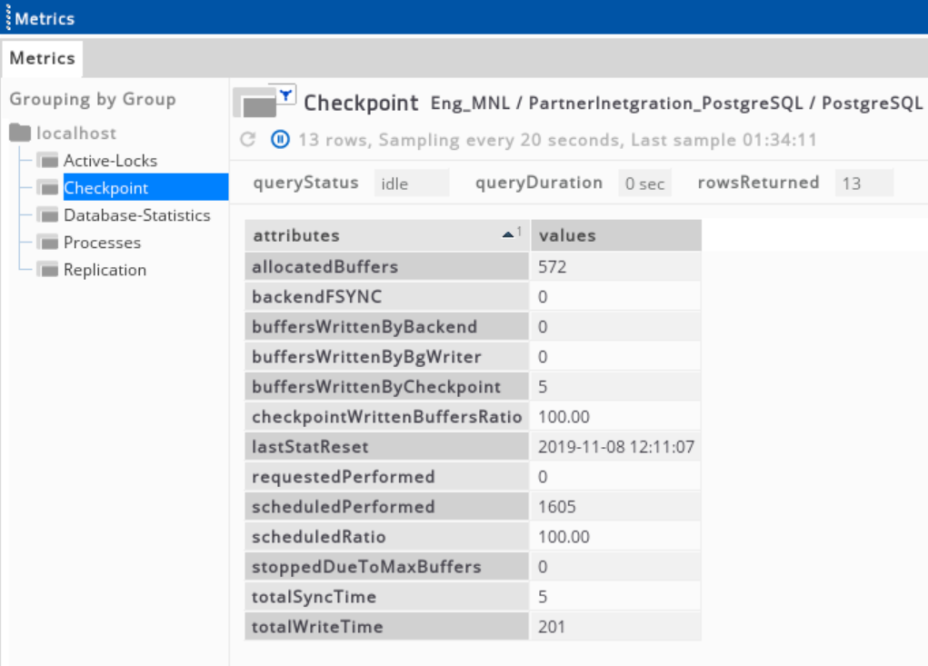
Checkpoint
| Column Name | Description |
|---|---|
| host | Configured host in the sampler. |
| scheduledPerformed | Number of scheduled checkpoints performed. |
| requestedPerformed | Number of requested checkpoints performed. |
| scheduledRatio | Equivalent to the ratio between scheduledPerformed and requestedPerformed. |
| totalWriteTime | Total amount of time spent in the checkpoint processing, where files are written to disk in milliseconds. |
| totalSyncTime | Total amount of time spent in the checkpoint processing, where files are synchronised to disk in milliseconds. |
| buffersWrittenByCheckpoint | Number of written buffers during the checkpoint. |
| buffersWrittenByBgWriter | Number of written buffers by the background writer. |
| stoppedDueToMaxBuffers | Number of times when a cleaning scan was stopped by the background writer due to the high volume of written buffers. |
| backendWrittenBuffers | Number of direct written buffers by a backend. |
| backendFSYNC | Number of times when a backend executed its own fsync call. |
| allocatedBuffers | Number of allocated buffers. |
| checkpointWrittenBuffersRatio | Equivalent to the ratio between buffersWrittenByCheckpoint, buffersWrittenByBgWriter, and backendWrittenBuffers. |
| lastStatReset | Time when the statistics were last reset. |
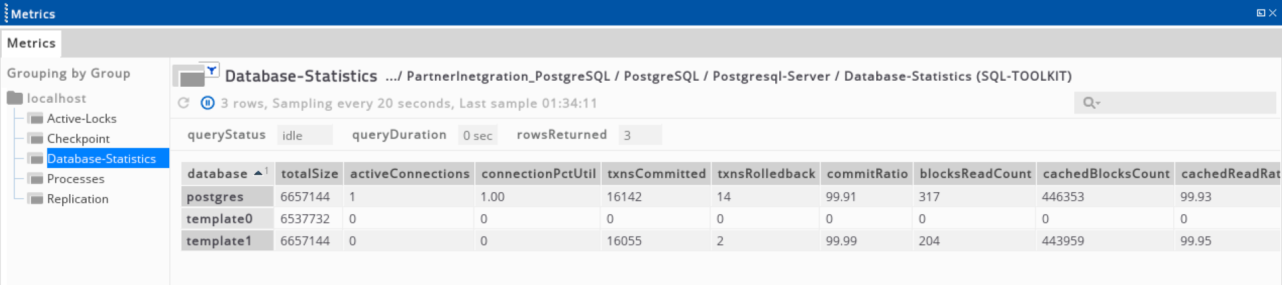
Database statistics
| Column Name | Description |
|---|---|
| database | Name of the database. |
| totalSize | Disk space used by the database. |
| activeConnections | Number of connected backends to the database. |
| connectionPctUtil | Equivalent to (activeConnections / max_connections) multiplied by a 100. |
| txnsCommitted | Number of transactions in the database committed. |
| txnsRolledback | Number of transactions in the database rolled back. |
| commitRatio | Equivalent to the ratio between txnsCommitted and txnsRolledback. |
| blocksReadCount | Number of disk blocks. |
| cachedBlocksCount | Number of times when disk blocks were found in the buffer cache. |
| cachedReadRatio | Equivalent to the ratio between blocksReadCount and cachedBlocksCount. |
| returnedRowsCount | Number of rows returned by queries. |
| fetchedRowsCount | Number of rows fetched by queries. |
| fetchedRatio | Equivalent to the ratio between returnedRowsCount and fetchedRowsCount |
| insertedRowsCount | Number of inserted rows by queries |
| updatedRowsCount | Number of update rows by queries. |
| deletedRowsCount | Number of deleted rows by queries. |
| deadlocksCount | Number detected deadlocks. |
| readTime | Time spent reading the data file blocks by the backend. |
| writeTime | Time spent writing the data file blocks by the backend. |
| lastStatReset | Time when the statistics were last reset. |
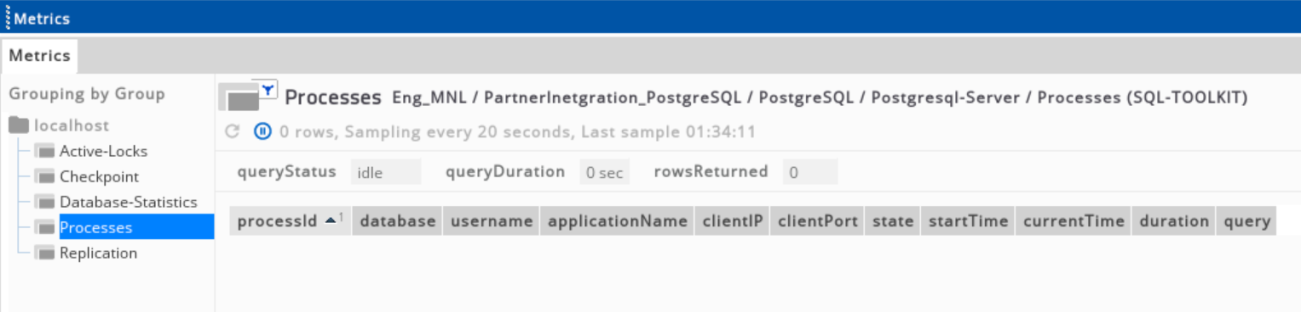
Processes
| Column Name | Description |
|---|---|
| processId | Process ID of the backend. |
| database | Name of the database where the backend is connected to. |
| username | Current user logged in the backend. |
| clientIP | IP address of the client. |
| clientPort | TCP port number the client is using to connect to the backend. |
| state | Current state of the backend. |
| startTime | Time when the current or last active query was started. |
| currentTime | Current time. |
| duration | Equivalent to the process age based on the currentTime and StartTime. |
| query | Most recent query in the backend. |
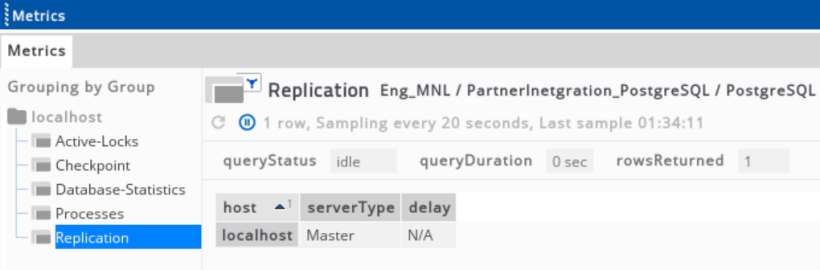
Replication
| Column Name | Description |
|---|---|
| host | Configured host in the sampler. |
| serverType | Type of server being used. |
| delay | Equivalent to the result of calculated delay on the current time minus the time stamp of the last transaction replayed during recovery. |