Overview
PostgreSQL monitoring is a Gateway configuration file that enables monitoring of Postgresql database installation through the SQL Toolkit plug-in.
This integration template allows monitoring of queries, views, triggers in the Gateway set-up, and other server activities, such as:
- Tracking of command being executed in the server.
- Monitoring of information about table and index dataview.
- Permits user-defined functions.
To view the sample metrics and dataviews, see PostgreSQL Monitoring Technical Reference.
Intended audience
This guide is intended for users who are setting up, configuring, troubleshooting and maintaining this integration. Once the integration is set up, the samplers providing the dataviews become available to that Gateway.
As a user, you should be familiar with SQL or any other database, and with the administration of the PostgreSQL services.
Prerequisites
The following requirements must be met prior to the installation and setup of the template:
- A machine running the Netprobe must have access to the host where the PostgreSQL instance is installed and the port PostgreSQL is listening to.
- Netprobe 4.6 or higher.
- Gateway 4.8 or higher.
- PostgreSQL 9.6.
Installation procedure
Ensure that you have read and can follow the system requirements prior to installation and setup of this integration template.
- Download the integration package
geneos-integration-postgresql-<version>.zipfrom the ITRS Downloads site. - Open Gateway Setup Editor.
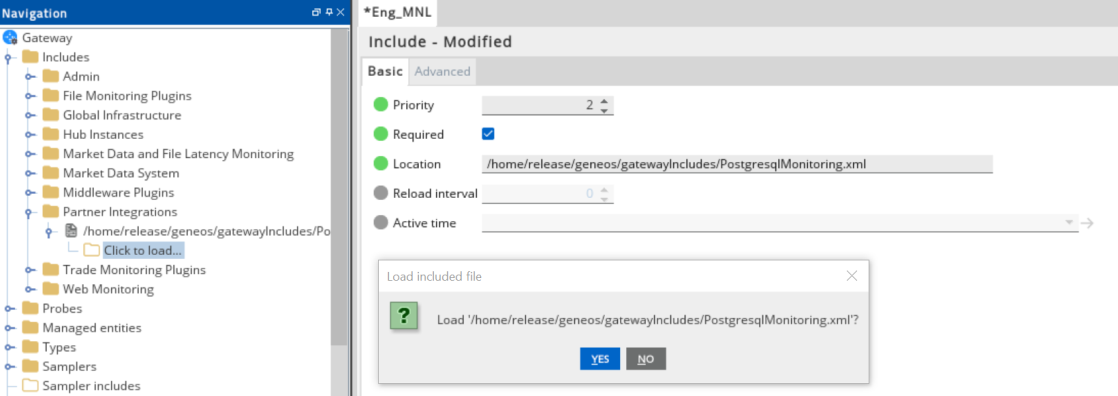
- In the Navigation panel, click Includes to create a new file.
- Enter the location of the file to include in the Location field. In this example, it is the
include/PostgreSQLMonitoring.xml. - Update the Priority field. This can be any value except
1. If you input a priority of1, the Gateway Setup Editor returns an error. - Expand the file location in the Include section.
- Select Click to load.
- Click Yes to load the new Postgresql include file.
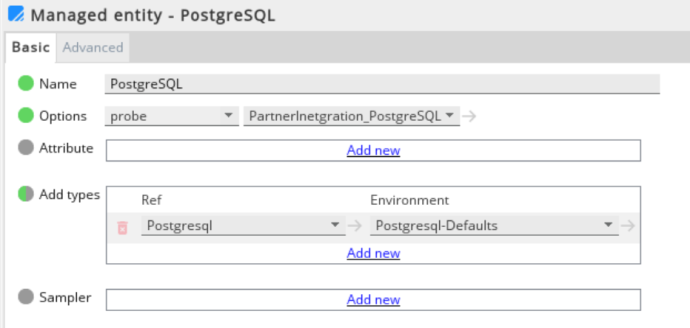
- Click Managed entities in the Navigation panel.
- Add the Postgresql type to the Managed Entity section that you will use to monitor Postgresql.
- Click Validate current document
 to check your configuration.
 - Click Save current document
 to apply the changes.
Set up the samplers
These are the pre-configured samplers available to use in PostgresqlMonitoring.xml.
Configure the required fields by referring to the table below:
| Samplers |
|---|
| Checkpoint |
| Database-Statistics |
| Processes |
| Replication |
| Active Locks |
Set up the variables
The PostgresqlMonitoring.xml template provides the variables that are set in the Environments section:
| Samplers | Description |
|---|---|
| PSQL_SERVER_NAME | IP/Hostname where the Postgresql installation resides. |
| PSQL_PORT | Assigned port in the Postgresql service. |
PSQL_USERNAME
|
Username with the rights to access the following tables. |
| PSQL_PASSWORD | Password of the database user. |
| PSQL_DBNAME |
Database names:
|
Set up the rules
The PostgresqlMonitoring-SampleRules.xml template also provides a separate sample rules that you can use to configure the Gateway Setup Editor.
Your configuration rules must be set in the Includes section.
If a rule has a critical and warning variable, you must configure it both to activate the rule:
| Variables | Critical | Warning |
|---|---|---|
| Checkpoint - Checkpoint Requests : Checks the ratio of checkpoints requested vs. scheduled checkpoints | PSQL_CHECKPOINT_SCHEDULED_CRITICAL: Possible values 1.0 - 100.0 |
PSQL_CHECKPOINT_SCHEDULED_WARNING: Possible values 1.0 - 100.0 |
| Database-Statistics - Commit Ratio : Checks the ratio between transactions committed vs rolledback | PSQL_COMMIT_RATIO_CRITICAL: Possible values 1.0 - 100.0 |
PSQL_COMMIT_RATIO_WARNING: Possible values 1.0 - 100.0 |
| Database-Statistics - Connection utilisation : Rule that checks the connections used expressed in percentage compared to max_connections | PSQL_CONNECTIONS_CRITICAL: Possible values 1.0 - 100.0 |
PSQL_CONNECTIONS_WARNING: Possible values 1.0 - 100.0 |
| Database-Statistics - Deadlocks : Checks for deadlocks | PSQL_DEADLOCK_RATIO_CRITICAL: Integer value |
PSQL_DEADLOCK_RATIO_WARNING: Integer value |
| Processes - Long Running Queries : Checks the duration of query execution | PSQL_QUERY_EXECUTION_THRESHOLD_IN_SECS_CRITICAL: Integer value |
PSQL_QUERY_EXECUTION_THRESHOLD_IN_SECS_WARNING: Integer value |
| Replication - Delay : Checks for delays in replication | PSQL_REPLICATION_DELAY_CRITICAL: Integer value. Time in seconds |
PSQL_REPLICATION_DELAY_WARNING: Integer value. Time in seconds |
| Checkpoint - Written Buffers Checkpoint : Checks the ratio of dirty buffers written by checkpoint vs bgwriter plus backends | PSQL_WRITTEN_BUFFERS_CRITICAL: Possible values 1.0 - 100.0 |
PSQL_WRITTEN_BUFFERS_WARNING: Possible values 1.0 - 100.0 |
| Database-Statistics - Size Threshold : Checks the size of the databases in the currently monitored server | PSQL_DATABASE_SIZE_CRITICAL: Possible values - XXX kB, XXX MB, XXX GB and XXX TB |
Not applicable |
Note: The sample configuration file was verified working with Postgresql 9.6 and Netprobe 4.5 versions.