If you are currently using version 5.x.x, we advise you to upgrade to the latest version before the EOL date. You can find the latest documentation here.
Monitoring strategy
Overview
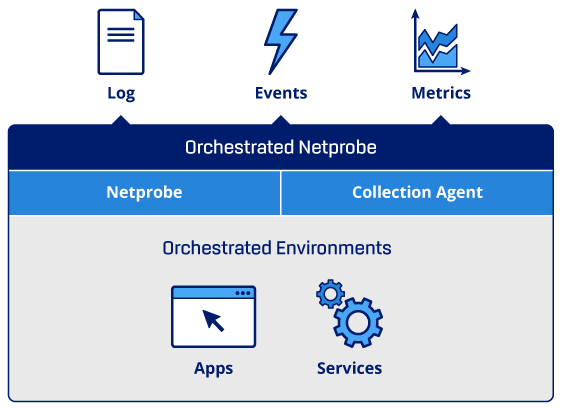
The latest Geneos distribution includes a new Netprobe package intended for Kubernetes and OpenShift. This package is designed specifically for these orchestrated environments. It facilitates the collection of application metrics, logs, and events in these highly dynamic environments.
An orchestrated environment is one where the provisioning and scaling of applications are defined declaratively, and an automated orchestrator or coordinator executes the requisite operations to deploy the applications. The most common example is the Kubernetes platform.
Difference from the regular Netprobe distribution
When running software in an orchestrated environment, the biggest impact on monitoring is its dynamic nature. Instances of services, even entire applications and instances, can come and go on demand. This presents a challenge from a data collection perspective as the identification of each instance must be dynamic. It is not feasible to manually configure a new collection profile each time an instance of a service or application is deployed.
A Collection Agent and Netprobe can be used together to dynamically collect, identify, and visualise application metrics in a constantly changing environment.
Additionally, this solution makes some improvements over standard Netprobes:
- Allows applications to push metrics and logs ensuring that nothing is lost. The Collection Agent's log processing plugins will persist logs on disk until it publishes them to the Netprobe, thus ensuring no data is lost in case the Netprobe is unavailable.
- Uses a dimensional data model which retains more information about the data being sent.
This package comes organised ready to be built into two individual containers: one container containing the Netprobe only, and a second container for the Collection Agent.
Supported platforms
Netprobe offers support for the following orchestration platforms:
- Kubernetes
- OpenShift
Versioning
All binaries are provided in platform-specific packages, which you can download from ITRS Downloads. For example, geneos-netprobe-<version>.kubernetes.tar.gz.
The latest version of each component is included in the package, and the package itself is versioned. The major version corresponds to the major version of Geneos
Netprobe architecture in Kubernetes environments
The Netprobe package runs as a DaemonSet on your cluster nodes. The Netprobe and the Collection Agent each run as a separate container in one pod. Collection Agent collects the data and forwards it to the Netprobe via a dedicated channel inside the Netprobe.
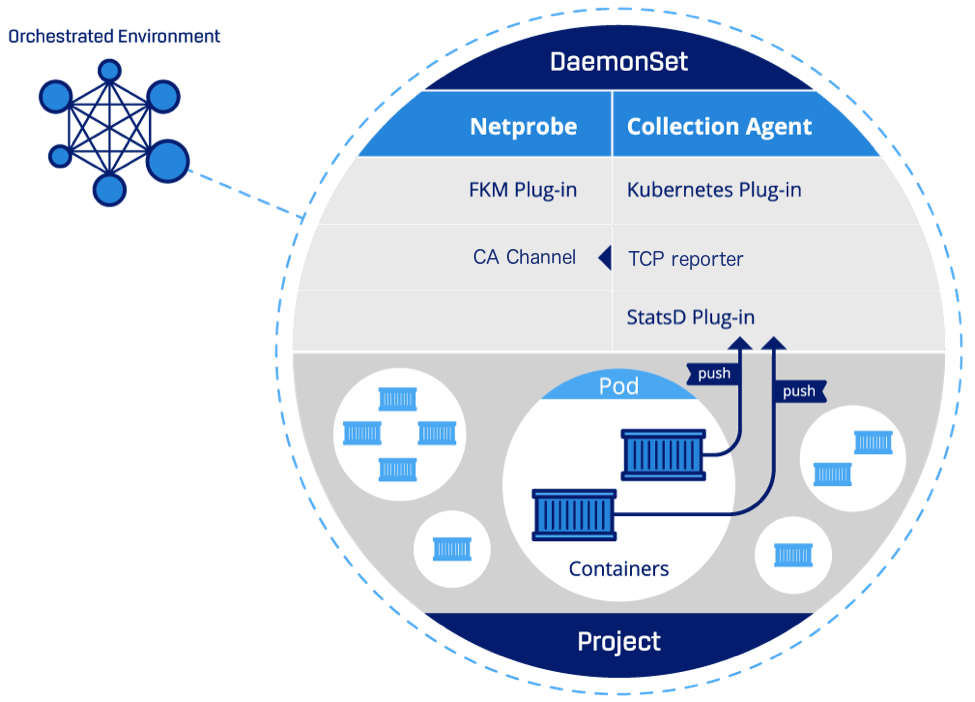
There is also an additional Netprobe package that runs as a regular pod deployment. This Netprobe collects metrics about Kubernetes components that are not node-based; for example, the deployments or the cluster itself.
Deploying the Netprobe and Collection Agent
Generally, a Netprobe and Collection Agent should be deployed to every node in a cluster. The recommended way to accomplish this is by deploying a DaemonSet, which Kubernetes ensures is running on each node. If some nodes are running applications that do not require monitoring, selectors can be used to exclude those nodes.
In some environments, it may be necessary to run additional
Netprobes or Collection Agent
instances beyond just the DaemonSet. For example, the KubernetesMetricsCollector
collects cluster-level Kubernetes metrics. If it ran on each node, duplicate
metrics would be reported.
To prevent this, we recommend running an additional standalone Netprobe for Orchestrated Environments instance that is not deployed as a DaemonSet but rather as a standard deployment with only a single replica. Refer to the Installation in a Kubernetes or OpenShift environment for an example of how this can be configured.
Identify sources of data
The Collection Agent ingests data as metrics, logs, or events.
The sources of metrics, logs, and events can be treated as Geneos entities. In Kubernetes, a sensible definition of an entity would be a process running in a container inside a pod. This could be a web server or some other type of application.
The Netprobe performs a mapping between data received by the Collection Agent and Geneos concepts.
Custom application instrumentation
To collect metrics from custom applications, you must instrument them with a client library that reports the sampled data to the Collection Agent using the StatsD protocol.
We provide instrumentation libraries for Java and Python applications. To install and use these, see StatsD client Java library and StatsD client Python library.
You can use any conforming StatsD library, but we recommended using the StatsD libraries provided by ITRS. These libraries have additional features beyond the base StatsD specification that allows for the collection of richer data.
See Deploy instrumented applications for more details.
Datapoints
The Collection Agent and Netprobe communicate using datapoints.
Structure
Datapoints are composed of the following elements:
| Element | Description |
|---|---|
| Metric name | Name of the metric recorded by a datapoint. |
| Type | Datapoints can record metric data in the following formats: Counter, Gauge, Log, or Timer histogram. |
| Value |
Value of the metric. |
| Dimension | One or more descriptive key-value pairs. Dimensions and metric names are used to uniquely identify datapoints. |
| Property | One or more descriptive key-value pairs. Properties do not affect the identity of datapoints. |
Dimensions
A datapoint is composed of, and uniquely defined by, a set of dimensions and a metric name. A dimension is a key-value pair.
You can generate arbitrary dimensions, but by default, a containerised application in Kubernetes possesses the following dimensions:
| Dimension | Example value |
|---|---|
|
|
node123.domain.com This is the name of the Kubernetes cluster node. |
on_pod_name
|
orchestrated-netprobe-ftrn6 This is the name of the Netprobe for Orchestrated Environments pod assigned by Kubernetes. |
namespace
|
finance |
pod_name
|
fixengine-6657fd674b-sb9bs |
container_name
|
router |
node_name
|
collection_team |
Time and rates
When datapoints contain data that are not natively supported by Geneos, these are converted to close equivalents.
Create mappings
Netprobes receive datapoints from the Collection Agent. The dimensions of each datapoint are determined by how you have instrumented your applications and by any Collection Agent plug-ins you are using. For more information, see StatsD client Python library and StatsD client Java library.
Additional dimensions can also be created using the label builder. For more information about using the label builder, see Use the label builder in Dynamic Entities.
Gateways organise data into entities. An entity represents an object being monitored, such as an application or a Kubernetes pod. Gateways format data into the following hierarchy:
- Entity
- Sampler
- Dataview
- Row
Mappings are used to construct a Geneos hierarchy from datapoints. The resulting Dynamic Entities are then created in the Gateway. To ensure a sensible hierarchy is created, you must choose dimensions and mappings carefully.
For more information about creating mappings, see Dynamic Entities.
Conventions for Kubernetes and OpenShift
In an orchestrated environment, you should create mappings that reflect the structure of that environment in the Geneos hierarchy. The example mappings do this.
Entities are at the top of the Geneos hierarchy, as such the following objects are typically mapped to Dynamic Entities:
- Containers
- Pods
- Nodes
Data from each type of object is then displayed in samplers that reflect the sources of data about each entity. In an orchestrated environment this will typically be StatsD and the Kubernetes Collection Agent plug-in.
Each sampler can contain multiple dataviews, you can use dataviews to group related metrics. To do this you should create dimensions that indicate relevant categories when instrumenting applications, you can then use mappings to create dataviews for each category. For example, a pod entity might have dataviews for metrics related to the pod filesystem.
Each dataview can contain multiple rows, this allows you to display the values of the same metrics for several different objects side by side.
When using the Kubernetes Collection Agent plug-in, a set of default dimensions is generated. The provided mapping templates work with these dimensions and follow the above guidelines.
Run an example
You can test the mapping and Dynamic Entities functionality using MiniGeneos. MiniGeneos includes Collection Agent self-monitoring by default and is distributed with an example Python application that has been instrumented using the StatsD client Python library.
For information about how to install MiniGeneos, see MiniGeneos.
To start MiniGeneos, run:
docker run --rm --init --name minigeneos --hostname minigeneos --interactive --tty -p 8080:8080 -p 8443:8443 -p 9092:9092 -p 7039:7039 -p 8081:8081 -p 8125:8125/udp docker.itrsgroup.com/minigeneos:latest
Connect to MiniGeneos using the Active Console, the workspace will show four entities.
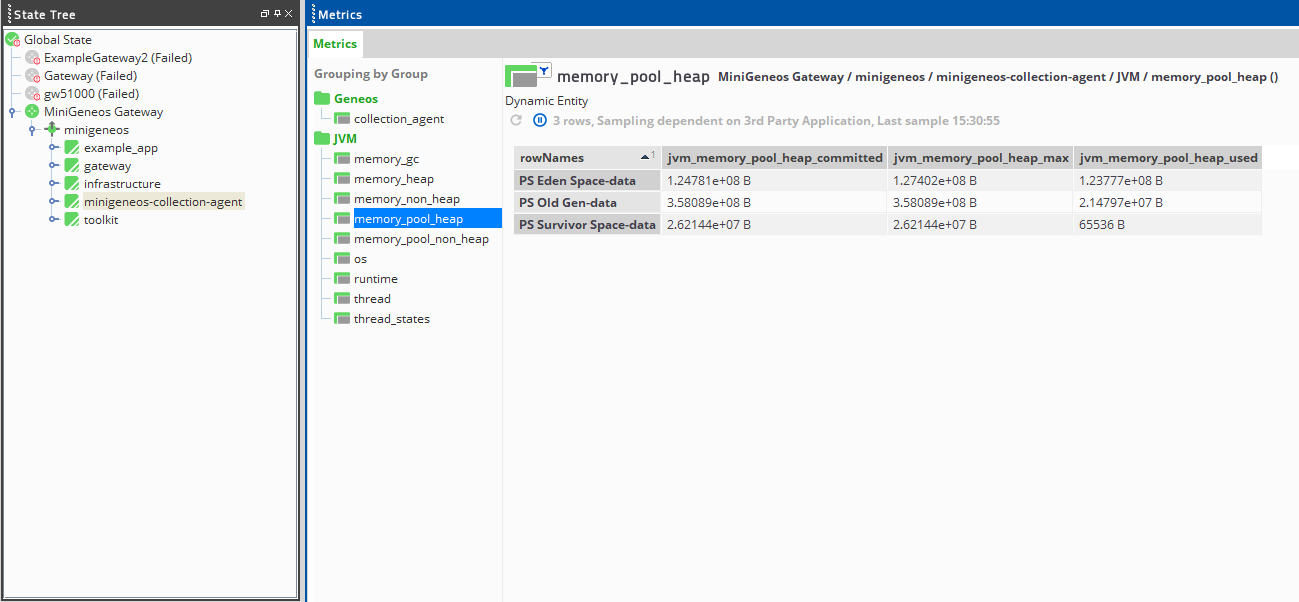
The minigeneos-collection-agent is a Dynamic Entity created using datapoints from the Collection Agent. From Active Console, Dynamic Entities are indistinguishable from normal Managed Entities.
To start the example application:
- Download the example application from the ITRS Github.
- Install the StatsD client Python library:
pip3 install itrsstatsd
- Start the example application:
python3 mypyapp.py
Note: You must have Python 3.7 or later installed to run the example application.
An additional entity will appear in the Active Console, this is created dynamically once the Netprobe begins receiving data from the example application.
Examine the mappings
These Dynamic Entities have been created using a simple mapping that is included in MiniGeneos by default.
To examine the mapping:
- Open the Gateway Setup Editor.
- Navigate to Dynamic Entities > Mappings > DefaultAppMapping.
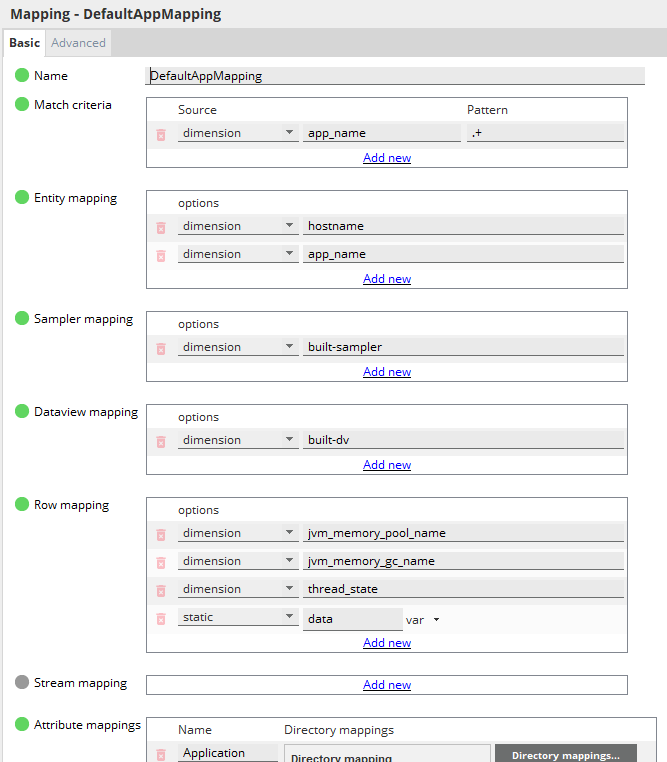
You can see how the mappings have been chosen to create sensible Dynamic Entities.
For example, entities are determined by the hostname and app_name dimensions which ensures that multiple instances of an application will result in separate and distinguishable Dynamic Entities.