Dashboards
Dashboards provide a way to view various elements monitored by Opsview Monitor in a summarized, visual way. Once set up, you can choose to display them on large TV’s in your Operations Center or throughout the office, per data center, office, customer, etc. which can act as the overall health indicator for how they are each performing.
The Dashboards feature is located within Monitoring > Dashboards. Dashlets are used to create customizable, resizable views that help with the analysis of ongoing events. These views are based on various elements of Opsview Monitor such as Events, Hashtags, Host Groups, Graph Center, etc.
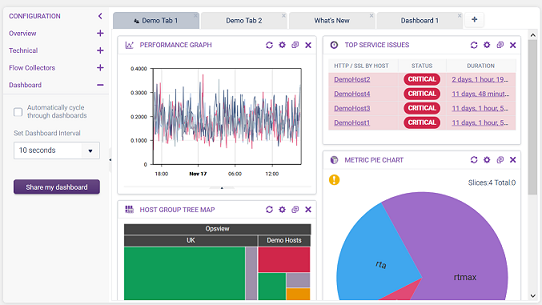
There are three main areas to the Dashboards page:
Dashboard tabs Copied
At the top of the screen, a bar is available with a ’+’ that allows you to add a new Dashboard. When you have more than one Dashboard configured, you can then navigate between tabs to access the different views you have set up.

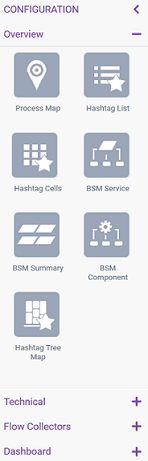
Configuration area Copied
On the left of the page, when clicking Configuration you can access dashlet templates that provide with different views: Overview, Technical, Flow Collectors. In addition, you can set the Dashboard to auto-refresh at a given interval and can also share the dashboard you are on with other Opsview Monitor users.
Dashboard area Copied
This is where the Dashlets live and where all the data you wish to view is located.
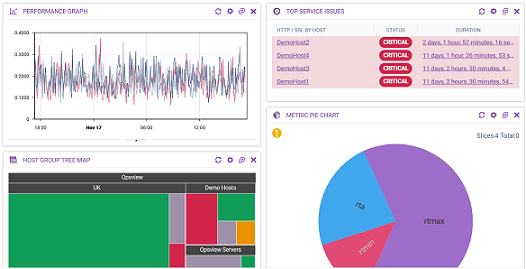
Dashlets can be resized vertically.
Dashlets Copied
The refresh buttons work like the other Automatic Refresh Buttons and are tied to the specific dashlet.
Additionally, if you change the refresh interval via the dashlet’s refresh button, this refresh interval is used in preference to the dashlet’s configured refresh interval. This allows non-owners of shared dashboards to make local changes for their own view.