Managing clusters and collectors
View clusters and collectors Copied
Clusters and collectors (also called monitoring clusters and monitoring collectors) can be viewed in the Configuration > Collector Management page. Only clusters which the user has configuration access to will be visible, and any collectors not in those clusters will be hidden. To view unregistered collectors, the user must have access to All Monitoring Clusters selected. For more information, see Role Configuration.
A remote collector is distinct from a standard collector, as it is managed remotely and is independent from the master monitoring server. For more details, refer to Remote Collector Management.
Prerequisites Copied
These are the detailed steps and prerequisites before adding new collector servers to a single-box system, and new collector servers to an existing Opsview Monitor system with multiple servers and existing collectors.
- A deployment host running a supported Operating System by the version of Opsview.
Additionally, unless deploying a Remotely Managed Collector:
- Root access to the deployment host.
- The
rootuser must be able to runsudowithout a password on all servers in the Opsview deployment. - SSH access from the deployment host to all servers in the Opsview deployment (including new servers to be added as collector hosts).
- Authentication must use SSH public keys.
- The remote user must be
rootor havesudoaccess without a password and without a terminal (TTY). Do not use the account nameopsviewas this will cause an account clash.
Add collector servers Copied
Note
These instructions explain how to deploy standard collectors. For details on how to add a remotely managed collector, instead refer to Remote Collector Management.
If you register additional collectors without running Apply Changes, some checks may fail with a CRITICAL "no such file or directory" error. After running Apply Changes, these failures will be resolved when checks are rerun.
To a single server system Copied
To add new collector servers to an existing single-server Opsview Monitor system, open the /opt/opsview/deploy/etc/opsview_deploy.yml file, and add the following lines.
Note
Do not change the existing lines inopsview_deploy.yml.
collector_clusters:
  collectors-de:
    collector_hosts:
      opsview-de-1: { ip: 10.12.0.9 }
Change opsview-de-1 and 10.12.0.9 to the hostname and IP address of your new collector, and give your collector cluster a name by changing collectors-de.
You may add multiple collector-clusters, and multiple collectors under each cluster such as:
collector_clusters:
  collectors-de:
    collector_hosts:
      opsview-de-1: { ip: 10.12.0.9 }
      opsview-de-2: { ip: 10.12.0.19 }
      opsview-de-3: { ip: 10.12.0.29 }

collectors-fr:
    collector_hosts:
      opsview-fr-1: { ip: 10.7.0.9 }
      opsview-fr-2: { ip: 10.7.0.19 }
      opsview-fr-3: { ip: 10.7.0.10 }
      opsview-fr-4: { ip: 10.7.0.20 }
      opsview-fr-5: { ip: 10.7.0.30 }
Note
There should always be an odd number of nodes within a collector cluster: 1, 3, and 5. This is to help with resiliency and avoid split-brain issues.
In an even number cluster, if half the nodes go down the other half will stop functioning as the cluster within opsview-datastore and opsview-messagequeue will have no quorum and so will not accept updates until the other cluster members are restored. We do not support clusters with only two collectors for the above reason.
In the example configuration above, two new collector clusters called collectors-de and collectors-fr are created.
The collectors-de cluster has the minimum requirement of 3 collector nodes, while collectors-fr has 5 collector nodes, with hostnames and IP addresses provided.
After modifying opsview_deploy.yml, run opsview deploy as follows:
cd /opt/opsview/deploy
./bin/opsview-deploy lib/playbooks/check-deploy.yml
./bin/opsview-deploy lib/playbooks/setup-hosts.yml
./bin/opsview-deploy lib/playbooks/setup-infrastructure.yml
./bin/opsview-deploy lib/playbooks/setup-opsview.yml
To register your collector and use the suggested host templates and associated variables needed for those templates, run:
./bin/opsview-deploy lib/playbooks/setup-monitoring.yml
Click Apply Changes within the UI after this has completed successfully for this step to take effect.
If you receive service check alerts similar to the below, then the above steps has not been run.
CRITICAL: Could Not Connect to localhost Response Code: 401 Unauthorized
To a multiple server system Copied
If you already have some collectors and you want to add new collectors, open /opt/opsview/deploy/etc/opsview_deploy.yml on your deployment server (which is typically opsview host with orchestrator and opsview-web) and add new collector clusters or collector hosts after existing ones such as:
collector_clusters:
  existing-collector1:
    collector_hosts:
      existing-host1: { ip: 10.12.0.9 }
      new-host1: { ip: 10.12.0.19 }
      new-host2: { ip: 10.12.0.29 }

  new-collector-cluster1:
    collector_hosts:
      new-host3: { ip: 10.7.0.9 }
      new-host4: { ip: 10.7.0.19 }
      new-host5: { ip: 10.7.0.29 }
In the example above, 5 new collector hosts exist (new-host1, new-host2, new-host3, new-host4 and new-host5), and 1 new collector cluster (new-collector-cluster1) have been added.
- new-host1 and 2 are added to the existing collector cluster (existing-collector1).
- new-host3, 4 and 5 are added to the new collector cluster (new-collector-cluster1).
After modifying opsview_deploy.yml, run opsview deploy as follows:
cd /opt/opsview/deploy
./bin/opsview-deploy lib/playbooks/check-deploy.yml
./bin/opsview-deploy lib/playbooks/setup-hosts.yml
./bin/opsview-deploy lib/playbooks/setup-infrastructure.yml
./bin/opsview-deploy lib/playbooks/datastore-reshard-data.yml
./bin/opsview-deploy lib/playbooks/setup-opsview.yml
If you wish to speed up this process you may specify the collector cluster you are updating or creating.
The best way to do this is to specify the collector cluster using the minus lowercase -l (l for Lima) option.
-
This is a measure really sided with updating a collector cluster, to ensure the opsview-messagequeue configuration is correct.
-
The below utilises the above cluster name of
existing-collector1, which is nowexisting_collector1.cd /opt/opsview/deploy ./bin/opsview-deploy -l opsview_cluster_existing_collector1 lib/playbooks/check-deploy.yml ./bin/opsview-deploy -l opsview_cluster_existing_collector1 lib/playbooks/setup-hosts.yml ./bin/opsview-deploy -l opsview_cluster_existing_collector1 lib/playbooks/setup-infrastructure.yml ./bin/opsview-deploy -l opsview_cluster_existing_collector1 lib/playbooks/datastore-reshard-data.yml ./bin/opsview-deploy -l opsview_cluster_existing_collector1 lib/playbooks/setup-opsview.yml
You may also use the collector names within double quotes if these are new collector clusters. For a single new collector cluster (a cluster or one), you may use the collector name or names of the collectors. This is also best practice for removing a collector from a cluster.
To register your collector and use the suggested host templates and associated variables needed for those templates, run:
./bin/opsview-deploy lib/playbooks/setup-monitoring.yml
Collector variables Copied
Note
These instructions are only applicable to standard collectors, not remotely managed collectors.
You may set specific component configuration against any Collector. Settings may be rolled out to individually or to all collectors by utilizing /opt/opsview/deploy/etc/user_vars.yml and /opt/opsview/deploy/etc/opsview_deploy.yml. In this example we shall look at setting specific examples against the opsview-executor configuration for all collectors, then for the existing-collector1 server.
To push out the configuration against all collectors upon a deployment, you will need to have a ov_component_overrides section and an applicable component section specified such as opsview_executor_config. This is set within the /opt/opsview/deploy/etc/user_vars.yml.
These changes are applied to the components <opsview-component>.yaml configuration file, so for the executor this is /opt/opsview/executor/etc/executor.yaml. The below will change the system defaults for initial_worker_count to 4 (a system default of 2) and max_concurrent_processes to 10 (a system default of 25).
ov_component_overrides:
  opsview_executor_config:
    initial_worker_count: 4
    max_concurrent_processes: 10
Then run a deployment using the ‘setup_everything.yaml` playbook to push out this configuration to all collectors.
If the configuration is only required on one collector then modify the /opt/opsview/deploy/etc/opsview_deploy.yml to add the overrides into the vars: section for specific collector, as follows:
collector_clusters:
  collectorcluster:
    collector_hosts:
      existing-collector1:
        ip: 10.12.0.9
        vars:
          ov_component_overrides:
            opsview_executor_config:
              initial_worker_count: 4
              max_concurrent_processes: 10
Instead of running the whole Deploy process, use the collector-install.yml playbook against the specific collector (as detailed in an above section). If multiple collectors within the same Cluster are modified, ensure you run the playbook against all of them at the same time by using the option -l collector1,collector2,collector3.
Monitor collector health Copied
If you are using SSH tunnels, you may notice after a new deployment that the collectors are monitoring themselves. If you are running an Opsview version older than 6.8.7, or have upgraded from a version older than 6.8.7 to a recent release, this change may not be in place by default.
Collectors must be monitored by their own clusters because of the SSH tunnel configuration. The orchestrator will still attempt to connect to the collectors on port 5666 for agent-based checks, but these will fail due to the tunnel’s direction. In the SSH tunnel setup, the collector’s Monitored By option must be set to its own hostname or collector cluster.
To ensure the orchestrator maintains a reference to the health of a collector’s connection from its own monitoring host, the OPSVIEW_COLLECTOR variable must be populated with an entry for the short hostname of each collector.
Cluster health Copied
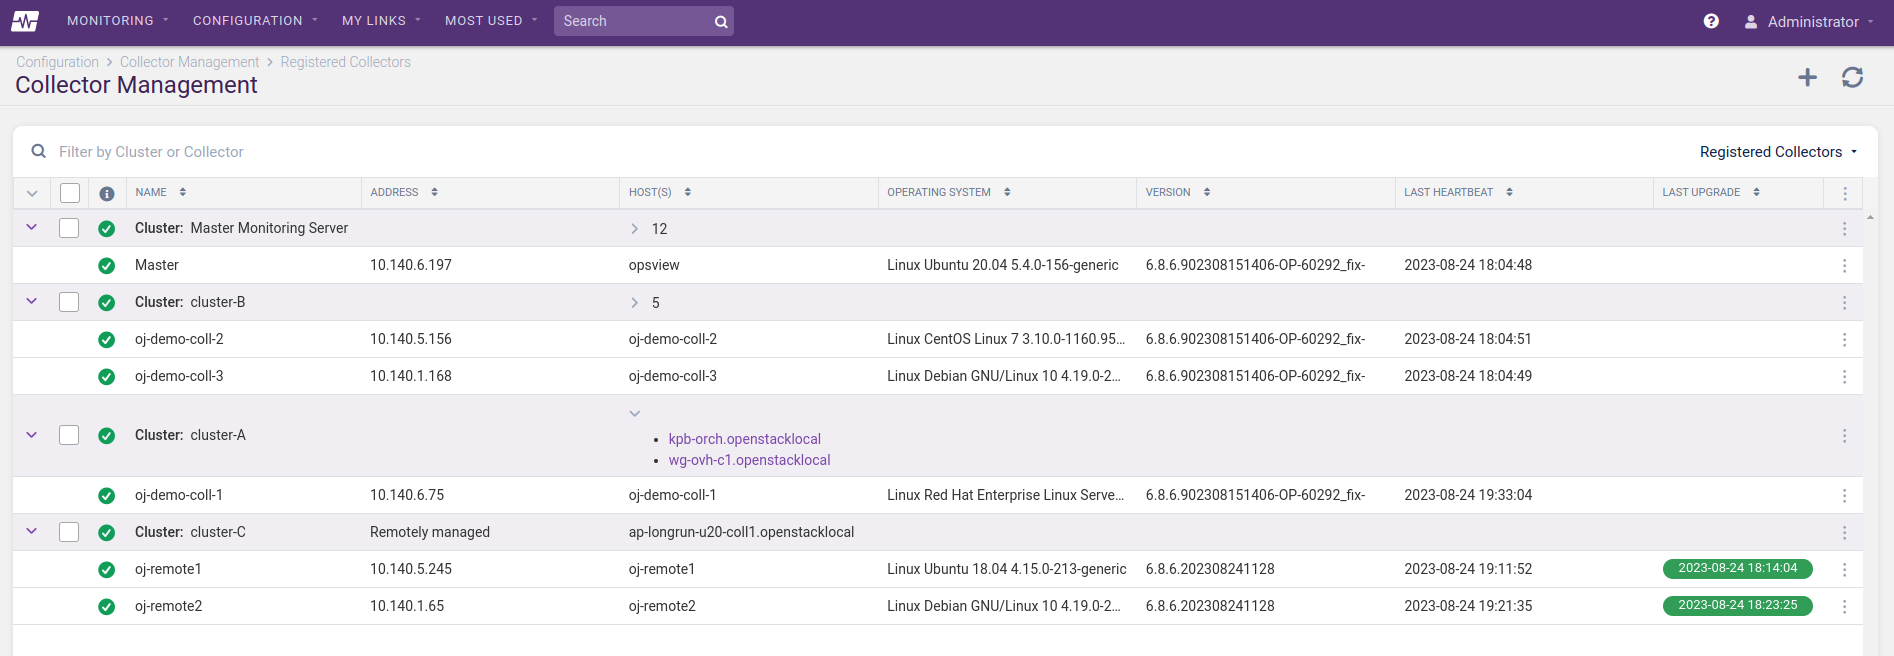
The Configuration > Collector Management page shows details on the health of both individual collector nodes and each cluster.
Notes for troubleshooting:
- The statuses directly relate to the processing of the cluster-health-queue shown during the command output of
/opt/opsview/messagequeue/sbin/rabbitmqctl list_queues. If you see a build up here, then the latest statuses will not be shown and this queue will need to be cleared before they are. - This may be completed with a rabbitmqctl
purge_queue cluster-health-queuecommand; usually needed to be run on your orchestrator server only. - If the queue is not purging, then stop and start the
opsview-schedulerandopsview-orchestratorcomponents.
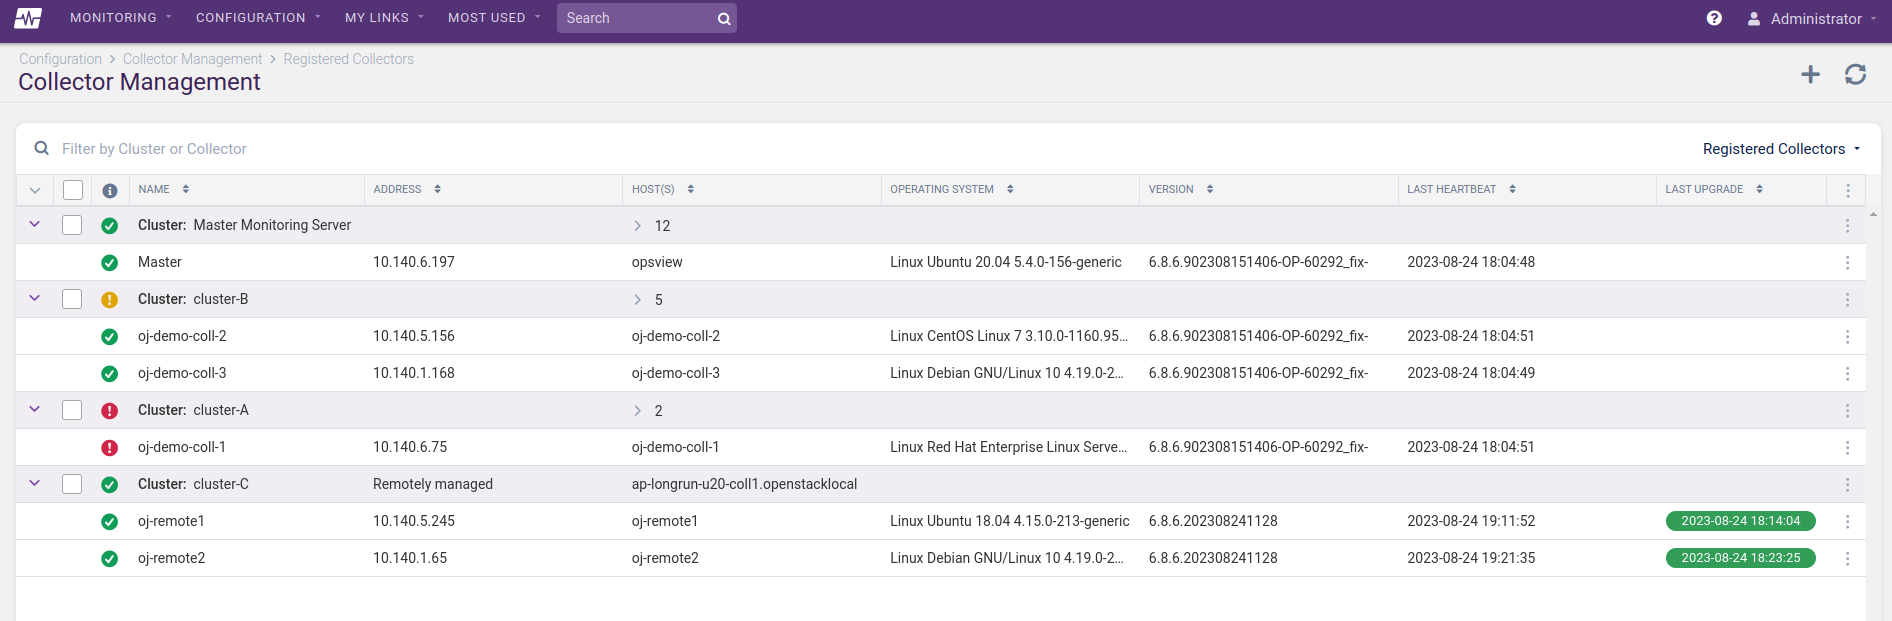
Cluster or collector Status Copied
The Status column shows the current state of the cluster or collector.
Possible values for clusters are:
| Icon | Description |
|---|---|
| Online Cluster is running normally. |
|
| Degraded Cluster has some issues. Hover over the status to get a list of alarms. |
|
| Offline Cluster has not responded within a set period, so is assumed to be offline. |
|
| N/A Cluster does not yet have a recorded cluster health status. |
Possible values for collectors are:
| Icon | Description |
|---|---|
| Online Collector is running normally. |
|
| Offline Collector has not responded within a set period, so is assumed to be offline. |
|
| N/A Collector does not yet have a recorded cluster health status. |
Cluster health alarms Copied
The following table describes the possible alarms that will be shown when users hover over the status of a DEGRADED cluster. These alarms refer to conditions of the following Opsview components:
- opsview-scheduler
- opsview-executor
- opsview-results-sender
- opsview-messagequeue
| Alarms | Description | Suggestions/Actions |
|---|---|---|
| All [Components Name] components are unavailable. For example, all opsview-executor components are unavailable. | Master/ Orchestrator server can’t communicate with any [Components Name] components on collector cluster. This may be because of a network/communications issue, or because no [Components Name] components are running on the cluster. This alarm only triggers when all [Components Name] components on the collector cluster are unavailable, since a cluster may be configured to only have these components running on a subset of the collectors. Furthermore, the cluster may be able to continue monitoring with some (though not all) of the [Components Name] components stopped. |
To resolve this, ensure that the master/orchestrator server can communicate with the collector cluster (i.e. resolve any network issues) and that at least one scheduler is running e.g. SSH to collector and run /opt/opsview/watchdog/bin/opsview-monit start [Component Name] |
| Not enough messages received ([Components Name 1] → [Components Name 2]): [Time Period] [Percentage Messages Received]%. For example, Not enough messages received (opsview-scheduler → opsview-executor):[15m] 0%. |
Less than 70% of the messages sent by [Components Name 1] have been received by [Components Name 2] within the time period. This could indicate a communication problems between the components on the collector cluster, or that [Components Name 2] is overloaded and is struggling to process the messages it is receiving in a timely fashion. For example, 0% messages sent by the scheduler have been received by the executor within a 15-minute period. |
If 0% of the messages sent have been received by [Components Name 2] and no other alarms are present then this may imply a communications failure on the cluster. To resolve this ensure that the collectors in the cluster can all communicate on all ports and that opsview-messagequeue is running on all the collectors without errors. Alternatively, this may be indicate that not all the required components are running on the collectors in the cluster. Please run /opt/opsview/watchdog/bin/opsview-monit summary on each collector to check that all the components are in a running state. If any are stopped then run /opt/opsview/watchdog/bin/opsview-monit start [component name]to start them. If > 0% messages sent have been received by [Components Name 2], then this likely implies a performance issue in the cluster. To address this you can reduce the load on the cluster: reduce the number of objects monitored by that cluster, reduce the number of checks being performed on each object in the cluster (i.e. remove host templates/service checks), increase the check interval for monitored hosts, increase the resources on the cluster, add additional collectors to the cluster, improve the hardware/resources of each collector in the cluster (i.e. investigate bottleneck by inspecting self-monitoring statistics and allocate additional CPU/memory resources as needed). |
| opsview-messagequeue degraded. | The Master messagequeue component is degraded. The opsview log on the orchestrator system will detail the exact error. This can be due to the following problems on one or more RabbitMQ nodes in the messagequeue cluster:
Since self-monitoring service checks may not run correctly if the Master messagequeue is not processing messages, this acts as a backup to indicate problems. |
To resolve these issues, follow the instructions at Opsview MessageQueue Troubleshooting. |
Note
For a fresh collector/cluster which has just been setup or which has minimal activity, the “Not enough messages received” alarm will be suppressed to avoid unnecessary admin/user concern. This does not impact the “All [Components Name] components are unavailable” alarm, which will still be raised for a offline collector.
Control check executions Copied
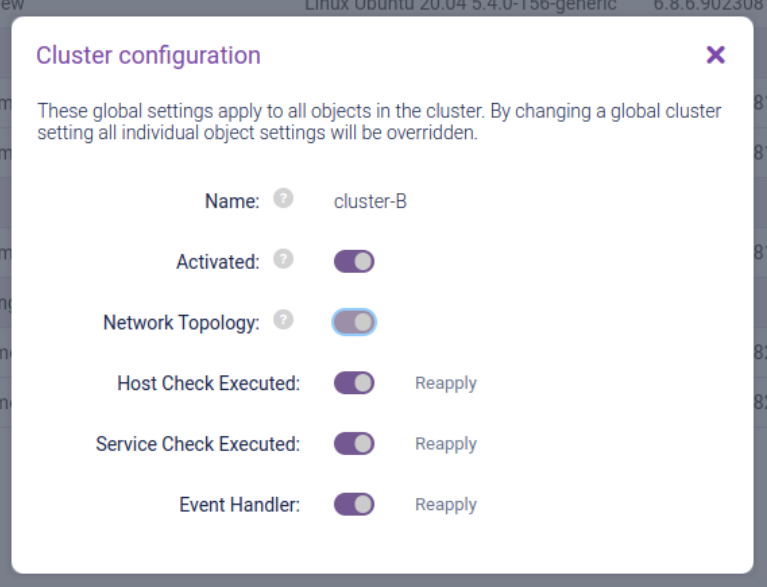
The Configuration > Collector Management page allows you to enable or disable various types of check execution on each Cluster.
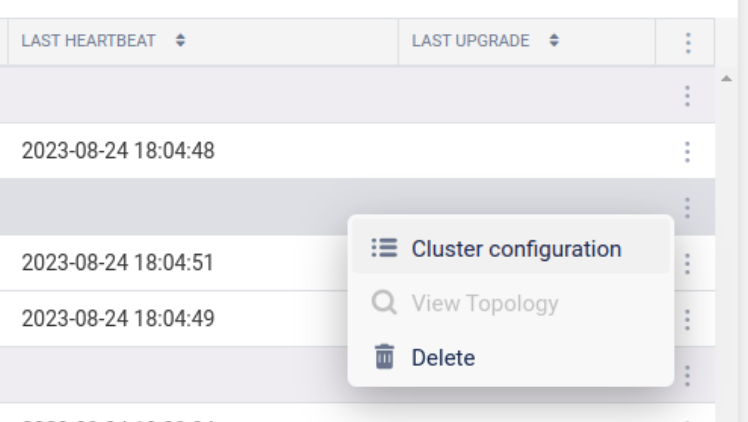
- To enable, open the contextual menu for a Cluster and click Cluster configuration.
- Select the Host Check Executed, Service Check Executed, or Event Handler toggle to turn execution on or off.
Network Topology Copied
If your subscription includes the Network Topology feature, the Configuration > Collector Management page allows you to enable or disable regular Network Topology detection on a per-cluster basis.
- To enable, open the contextual menu for a Cluster and select Cluster configuration:
- Then click the Network Topology toggle:
- Once Network Topology detection has been carried out and a map is ready to be displayed for a particular cluster, it can be accessed by selecting View Topology in the Cluster contextual menu:
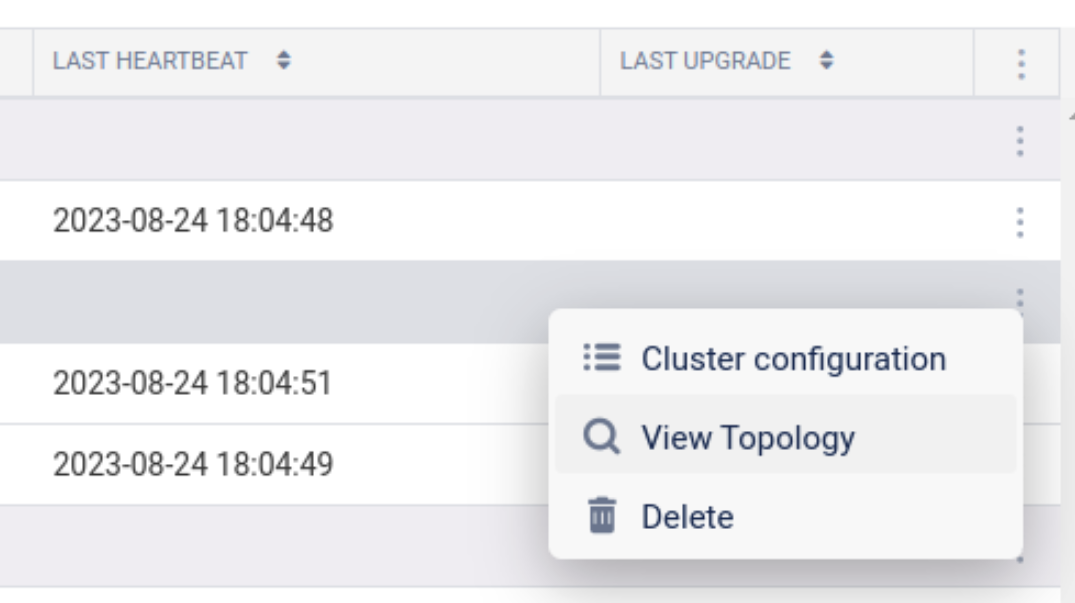
For further information on the contents of the Network Topology map, refer to Viewing Network Topology Maps.
Delete a cluster or collector Copied
Note
These instructions are only applicable to standard collectors, not Remotely Managed collectors.
The steps are slightly different depending on the size of the cluster.
Note
If you have deleted a collector but then you want to register it again, you will not see it become available in the Unregistered collectors grid until you stop the Scheduler on that collector for at least a whole minute and then restart it.
Delete a cluster Copied
Note
If a cluster only contains one collector, that collector cannot be deleted. Instead, the entire cluster must be deleted.
- Ensure no Hosts are currently monitored by the Cluster.
- Navigate to the Configuration > Collector Management page.
- Edit the Cluster configuration then uncheck the ‘Activated’ box and click Submit Changes. You will then need to Apply Changes.
- Delete the Cluster via the cluster contextual menu.
- Apply Changes.
- Edit your deploy files (
/opt/opsview/deploy/etc/opsview_deploy.yml,/opt/opsview/deploy/etc/user_vars.yml, and others as appropriate) to either comment out or remove the lines for the deleted Cluster.
Delete a collector in a multi-collector cluster Copied
-
Navigate to the Configuration > Collector Management page.
-
Delete the Collector via the collector contextual menu.
-
Edit your deploy files (
/opt/opsview/deploy/etc/opsview_deploy.yml,/opt/opsview/deploy/etc/user_vars.yml, and others as appropriate) to either comment out or remove the lines for the deleted Collector. -
Run a full deployment on the Cluster by running this command:
/opt/opsview/deploy/bin/opsview-deploy -l collector1,collector2,collector3 /opt/opsview/deploy/lib/playbooks/setup-everything.yml
Upgrade a collector Copied
Remotely managed collector clusters are upgraded independently. See Upgrading Remotely Managed Collectors for instructions.
Standard collectors are upgraded with the rest of your Opsview System. See Automated In-Place Upgrade for further details.
Manage monitoring scripts Copied
In a distributed Opsview Monitor system, monitoring scripts (plugins, notification scripts, and event handlers) are distributed to all clusters, including standard and remotely managed collectors as part of the Apply Changes process.