Overview
OP5 Monitor uses PNP4Nagios to create graphs in the OP5 Monitor user interface. The procedures below explain how to configure graphs in OP5 Monitor, including:
- Creating combined graphs.
- Creating graph collections.
- Creating graph templates.
- Configuring the OP5 Monitor graph front end.
For more information on the reporting function for viewing graphs, including viewing combined graphs and graph collections, see View graphs.
Combined graphs
Combined graphs overlay several graphs in the same graph, to give a better overview of how different checks are performing. It takes services from one or more hosts and lays them on top of each other in the same graph.
Service checks must have the same name on all the hosts for combined graphs to work.
To create a combined graph:
- In the OP5 Monitor interface, click Manage > Configure.
- In the Graphs section, click Combined graphs.
- Enter the Title and a Comment.
- Select the graph Type.
- Select the host and service combinations to add to the graph.
- Click Submit.
Graph collections
Collections make it possible to collect graphs of different hosts and services on one page.
To create a new collection:
- In the OP5 Monitor interface, click Manage > Configure.
- In the Graphs section, click Graph collection.
- Enter the Page name.
- Select the graphs to add to the collection, in one of the following ways:
- Click them in the Services list.
- Check the Use regular expressions checkbox and specify the host and service name graphs as regular expressions. Note that regular expressions are case sensitive. The regular expressions in the following screenshot select all graphs from hosts with names starting with
switchand services with names beginning withInterfaceand containingTraffic.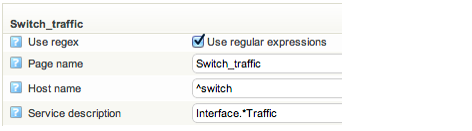
- To view your collection, open Report > Graphs. A list of links to collections appears at the bottom right of the page. You can also enter a search term to search for a collection.
Graph templates
Graph templates control how your graphs look. By changing the template for a check command, you can customise how the graph for that check looks.
If you add a custom plugin to OP5 Monitor and it does not create any graphing data, you need to create a new template for it.
Enable graph prediction
Graph prediction plots a line across a graph to predict when it will cross thresholds.
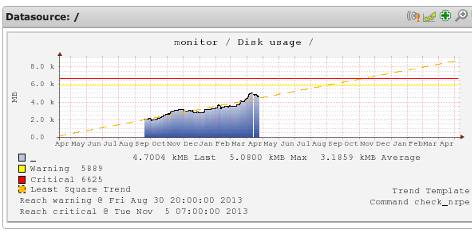
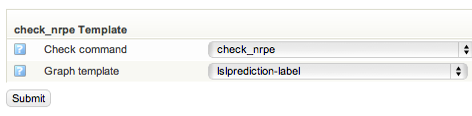
Graph prediction is not enabled by default. To enable graph prediction, change the check command to use the lslprediction-label template. For guidance, see Configure a graph template in Manage templates and time periods.
Create a new graph template
You can create new custom graph templates in directory /op5/monitor/op5/pnp/templates, by creating a .php file named after a plugin. The graph template must not produce any output and it must be valid PHP.
Graph templates set two variables: $opt and $def. Setting a value for $opt is optional, but you must always set a value for $def. The two variables are arrays which contain one value for each graph, so to create three graphs, you need to have three values in $opt and three values in $def. The values are long text strings containing arguments and data for the graph engine.
Example template
An example first data series looks like this:
$def[1] = "";
$def[1] .= "DEF:ds1=$rrdfile:$DS[1]:AVERAGE ";
$def[1] .= 'LINE:ds1#00FF00:"Percentage points " ';
- The first line only initialises
$def[1]with an empty string, so that you do not have to remember to change the assignment operator in later lines. - The second line defines a data series or data source, calls it
ds1and gives it the value of the first data series returned by the plugin.AVERAGEmeans that the graph engine uses the average of the values returned, if there is more than one. - The third line tells the graph engine how to draw the data. In this example, data is drawn as a line in the colour
#00FF00, which is the hexadecimal RGB value for green, with a legend namedPercentage points.
This produces a clean graph with a single green line showing the first of the data series returned by the plugin after which the template is named.
You can add a second data series to the graph by adding these two lines:
$def[1] .= "DEF:ds2=$rrdfile:$DS[2]:AVERAGE ";
$def[1] .= 'LINE:ds2#0000FF:"Pirate population" ';
Then, create a title for the graph and y-axis, all on one line:
$opt[1] = '--title "Pirate population / global temperature change" --vertical-label "pirates / degrees"';
You can also change the second data series to draw an area instead of a line:
$def[1] .= 'AREA:ds2#0000FF:"Pirate population" ';
The first line has now disappeared behind the blue area in the graphs. This is because graph objects are drawn in the order in which they are specified in the template file, so first the line is drawn and then the blue area is drawn over it.
If you change round the first and second statements, the green line is drawn over the blue area.
You can also change the first line to be an area:
$def[1] .= 'AREA:ds1#00FF00:"Global temperature increase in %":STACK ';
The last part, :STACK, means that the second area is stacked on top of the first. This is a useful way to show values that add up to a total, such as bandwidth usage per customer or memory usage per application.
For more information on creating graph templates, see the Nagios graph template documentation.
Configure the web front end for graphs
You access the web front end for graphs in OP5 Monitor using menu option Report > Graphs.
The configuration for the PNP web front end is in file /opt/monitor/etc/pnp/config.php. Updating this file directly, however, is not recommended, as PNP updates will overwrite the file. You can create a local version of the file called config_local.php, using config.php for guidance.
All variables in your local configuration file are inherited from config.php, unless you overwrite them, so you do not need to copy the whole file to change one variable.
To configure the web front end:
- Create a new local PNP configuration file with the following name and location:
/opt/monitor/etc/pnp/config_local.php
- Update the values as required. The file must always begin with
<?php. The following example shows what the code should look like in order to set the graph width to 1500:<?php
$conf['graph_width'] = "1500";
When adding a new object that produces graphs, you can expect a 5 minute delay before the graph is rendered.