If you are currently using version 5.x.x, we advise you to upgrade to the latest version before the EOL date. You can find the latest documentation here.
PostgreSQL
Overview
PostgreSQL monitoring is a Gateway configuration file that enables monitoring of Postgresql database installation through the SQL Toolkit plug-in.
This integration template allows monitoring of queries, views, triggers in the Gateway set-up, and other server activities, such as:
- Tracking of command being executed in the server.
- Monitoring of information about table and index dataview.
- Permits user-defined functions.
Intended audience
This guide is intended for users who are setting up, configuring, troubleshooting and maintaining this integration. This is intended for users who will be using Active Console to monitor data from PostgreSQL. Once the integration is set up, the samplers providing the dataviews become available to that Gateway.
As a user, you should be familiar with SQL or any other database, and with the administration of the PostgreSQL services.
Prerequisites
The following requirements must be met prior to the installation and setup of the template:
- A machine running the Netprobe must have access to the host where the PostgreSQL instance is installed and the port PostgreSQL is listening to.
- Netprobe 4.6 or higher.
- Gateway 4.8 or higher.
- PostgreSQL 9.6.
Installation procedure
Ensure that you have read and can follow the system requirements prior to installation and setup of this integration template.
- Download the integration package
geneos-integration-postgresql-<version>.zipfrom the ITRS Downloads site. - Open Gateway Setup Editor.
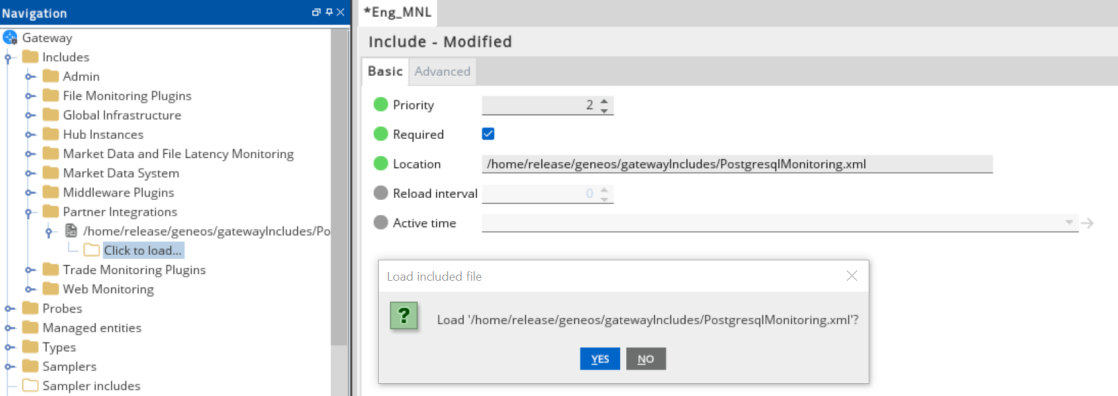
- In the Navigation panel, click Includes to create a new file.
- Enter the location of the file to include in the Location field. In this example, it is the
include/PostgreSQLMonitoring.xml. - Update the Priority field. This can be any value except
1. If you input a priority of1, the Gateway Setup Editor returns an error. - Expand the file location in the Include section.
- Select Click to load.
- Click Yes to load the new Postgresql include file.
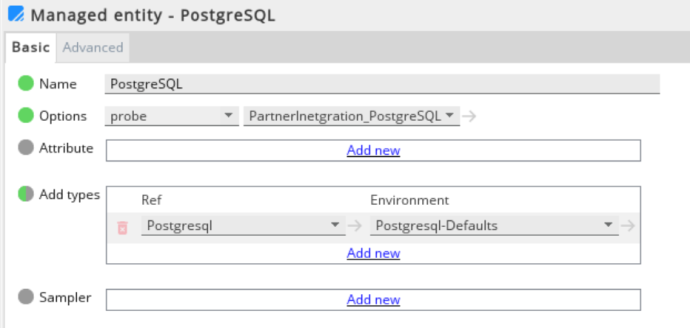
- Click Managed entities in the Navigation panel.
- Add the Postgresql type to the Managed Entity section that you will use to monitor Postgresql.
- Click Validate current document
 to check your configuration.
 - Click Save current document
 to apply the changes.
Set up the samplers
These are the pre-configured samplers available to use in PostgresqlMonitoring.xml.
Configure the required fields by referring to the table below:
| Samplers |
|---|
| Checkpoint |
| Database-Statistics |
| Processes |
| Replication |
| Active Locks |
Set up the variables
The PostgresqlMonitoring.xml template provides the variables that are set in the Environments section:
| Samplers | Description |
|---|---|
| PSQL_SERVER_NAME | IP/Hostname where the Postgresql installation resides. |
| PSQL_PORT | Assigned port in the Postgresql service. |
PSQL_USERNAME
|
Username with the rights to access the following tables. |
| PSQL_PASSWORD | Password of the database user. |
| PSQL_DBNAME |
Database names:
|
Set up the rules
The PostgresqlMonitoring-SampleRules.xml template also provides a separate sample rules that you can use to configure the Gateway Setup Editor.
Your configuration rules must be set in the Includes section.
If a rule has a critical and warning variable, you must configure it both to activate the rule:
| Variables | Critical | Warning |
|---|---|---|
| Checkpoint - Checkpoint Requests : Checks the ratio of checkpoints requested vs. scheduled checkpoints | PSQL_CHECKPOINT_SCHEDULED_CRITICAL: Possible values 1.0 - 100.0 |
PSQL_CHECKPOINT_SCHEDULED_WARNING: Possible values 1.0 - 100.0 |
| Database-Statistics - Commit Ratio : Checks the ratio between transactions committed vs rolledback | PSQL_COMMIT_RATIO_CRITICAL: Possible values 1.0 - 100.0 |
PSQL_COMMIT_RATIO_WARNING: Possible values 1.0 - 100.0 |
| Database-Statistics - Connection utilisation : Rule that checks the connections used expressed in percentage compared to max_connections | PSQL_CONNECTIONS_CRITICAL: Possible values 1.0 - 100.0 |
PSQL_CONNECTIONS_WARNING: Possible values 1.0 - 100.0 |
| Database-Statistics - Deadlocks : Checks for deadlocks | PSQL_DEADLOCK_RATIO_CRITICAL: Integer value |
PSQL_DEADLOCK_RATIO_WARNING: Integer value |
| Processes - Long Running Queries : Checks the duration of query execution | PSQL_QUERY_EXECUTION_THRESHOLD_IN_SECS_CRITICAL: Integer value |
PSQL_QUERY_EXECUTION_THRESHOLD_IN_SECS_WARNING: Integer value |
| Replication - Delay : Checks for delays in replication | PSQL_REPLICATION_DELAY_CRITICAL: Integer value. Time in seconds |
PSQL_REPLICATION_DELAY_WARNING: Integer value. Time in seconds |
| Checkpoint - Written Buffers Checkpoint : Checks the ratio of dirty buffers written by checkpoint vs bgwriter plus backends | PSQL_WRITTEN_BUFFERS_CRITICAL: Possible values 1.0 - 100.0 |
PSQL_WRITTEN_BUFFERS_WARNING: Possible values 1.0 - 100.0 |
| Database-Statistics - Size Threshold : Checks the size of the databases in the currently monitored server | PSQL_DATABASE_SIZE_CRITICAL: Possible values - XXX kB, XXX MB, XXX GB and XXX TB |
Not applicable |
Note: The sample configuration file was verified working with Postgresql 9.6 and Netprobe 4.5 versions.
Metrics and dataviews
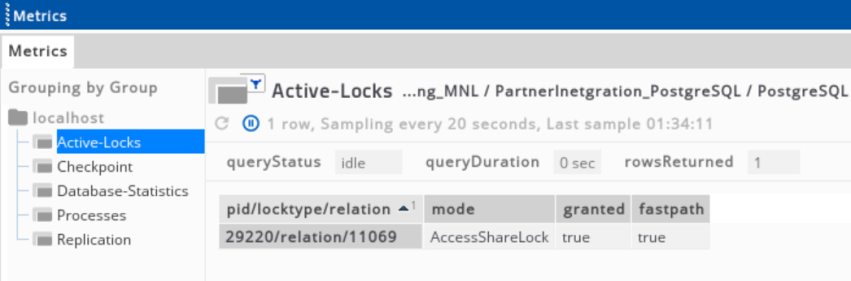
Active locks
| Column Name | Description |
|---|---|
| pid/lockType/relation | Lock information held by active processes in the database server. |
| mode | Refers to the name of the lock mode held by active processes. |
| granted | Set to True if lock was held, or to False if lock was awaited. |
| fastpath | Set to True if lock was taken via fast path, or to False if taken via main lock table. |
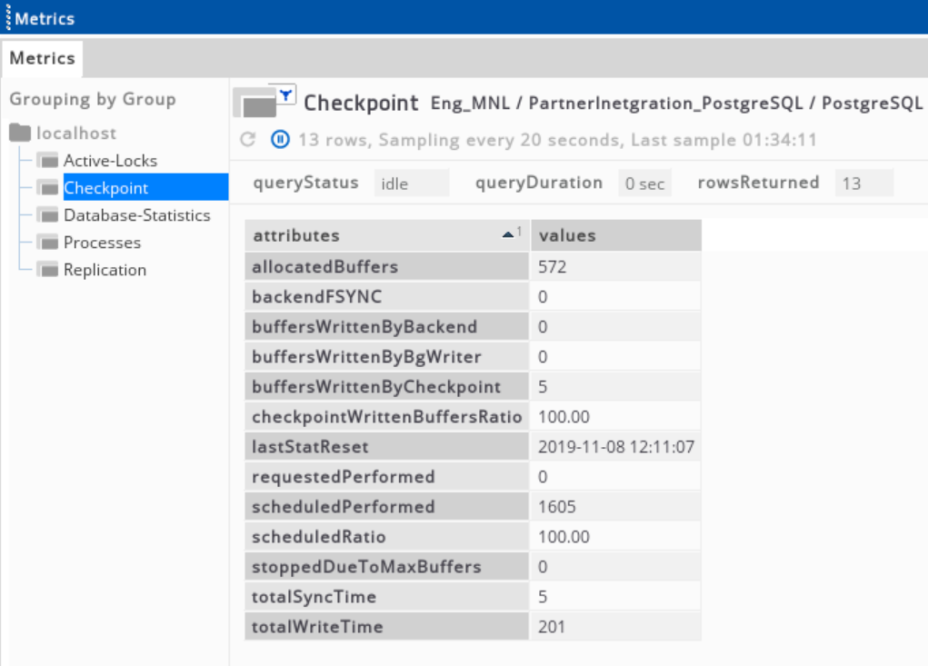
Checkpoint
| Column Name | Description |
|---|---|
| host | Configured host in the sampler. |
| scheduledPerformed | Number of scheduled checkpoints performed. |
| requestedPerformed | Number of requested checkpoints performed. |
| scheduledRatio | Equivalent to the ratio between scheduledPerformed and requestedPerformed. |
| totalWriteTime | Total amount of time spent in the checkpoint processing, where files are written to disk in milliseconds. |
| totalSyncTime | Total amount of time spent in the checkpoint processing, where files are synchronised to disk in milliseconds. |
| buffersWrittenByCheckpoint | Number of written buffers during the checkpoint. |
| buffersWrittenByBgWriter | Number of written buffers by the background writer. |
| stoppedDueToMaxBuffers | Number of times when a cleaning scan was stopped by the background writer due to the high volume of written buffers. |
| backendWrittenBuffers | Number of direct written buffers by a backend. |
| backendFSYNC | Number of times when a backend executed its own fsync call. |
| allocatedBuffers | Number of allocated buffers. |
| checkpointWrittenBuffersRatio | Equivalent to the ratio between buffersWrittenByCheckpoint, buffersWrittenByBgWriter, and backendWrittenBuffers. |
| lastStatReset | Time when the statistics were last reset. |
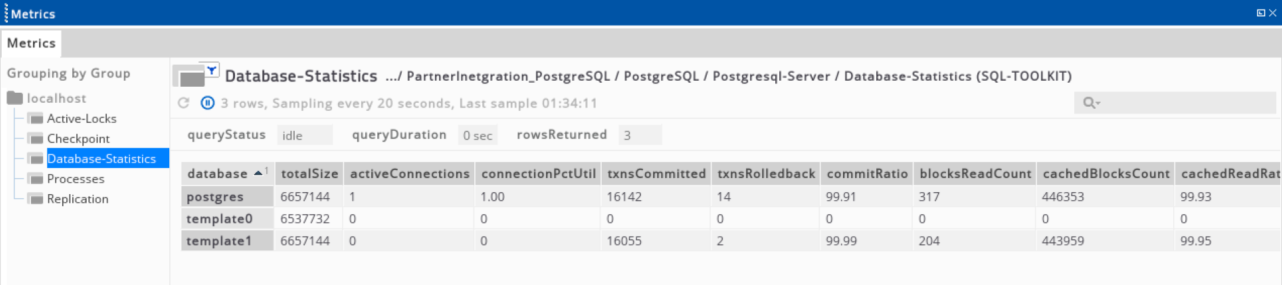
Database statistics
| Column Name | Description |
|---|---|
| database | Name of the database. |
| totalSize | Disk space used by the database. |
| activeConnections | Number of connected backends to the database. |
| connectionPctUtil | Equivalent to (activeConnections / max_connections) multiplied by a 100. |
| txnsCommitted | Number of transactions in the database committed. |
| txnsRolledback | Number of transactions in the database rolled back. |
| commitRatio | Equivalent to the ratio between txnsCommitted and txnsRolledback. |
| blocksReadCount | Number of disk blocks. |
| cachedBlocksCount | Number of times when disk blocks were found in the buffer cache. |
| cachedReadRatio | Equivalent to the ratio between blocksReadCount and cachedBlocksCount. |
| returnedRowsCount | Number of rows returned by queries. |
| fetchedRowsCount | Number of rows fetched by queries. |
| fetchedRatio | Equivalent to the ratio between returnedRowsCount and fetchedRowsCount |
| insertedRowsCount | Number of inserted rows by queries |
| updatedRowsCount | Number of update rows by queries. |
| deletedRowsCount | Number of deleted rows by queries. |
| deadlocksCount | Number detected deadlocks. |
| readTime | Time spent reading the data file blocks by the backend. |
| writeTime | Time spent writing the data file blocks by the backend. |
| lastStatReset | Time when the statistics were last reset. |
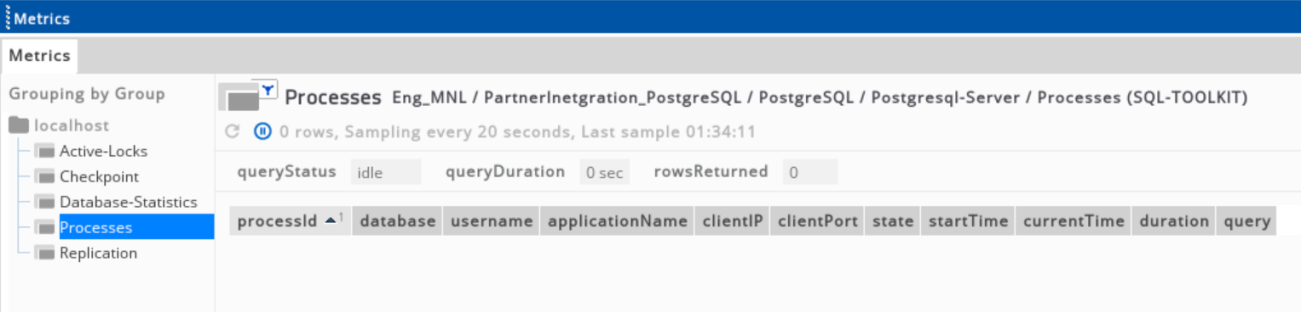
Processes
| Column Name | Description |
|---|---|
| processId | Process ID of the backend. |
| database | Name of the database where the backend is connected to. |
| username | Current user logged in the backend. |
| clientIP | IP address of the client. |
| clientPort | TCP port number the client is using to connect to the backend. |
| state | Current state of the backend. |
| startTime | Time when the current or last active query was started. |
| currentTime | Current time. |
| duration | Equivalent to the process age based on the currentTime and StartTime. |
| query | Most recent query in the backend. |
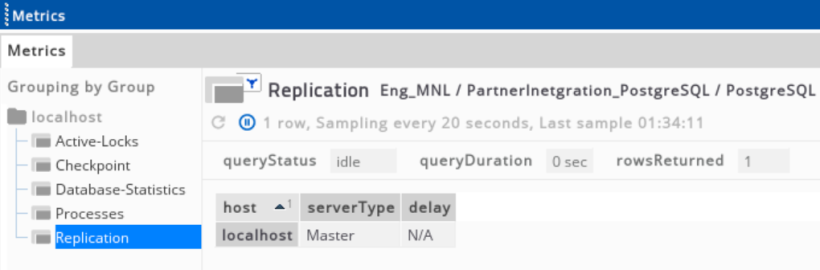
Replication
| Column Name | Description |
|---|---|
| host | Configured host in the sampler. |
| serverType | Type of server being used. |
| delay | Equivalent to the result of calculated delay on the current time minus the time stamp of the last transaction replayed during recovery. |