If you are currently using version 5.x.x, we advise you to upgrade to the latest version before the EOL date. You can find the latest documentation here.
Quickstart Guide
Overview
This document helps you get started with Active Console. It provides more details about the basic features and tools that you can use when configuring Active Console. Also, it gives you a list of recommended activities when you start configuring your workspace and shows a list of advanced features for experience users.
Experienced users may wish to skip ahead to other specific guides available for Active Console in the Active Console Documentation Home.
Intended audience
This guide is intended for users who already have an Active Console setup in their local machines, and want to get familiar with using the application. Before you proceed, we recommend that you read the System Requirements and Download and Setup topics.
Open Active Console
Run the
ActiveConsole.exe executable that is located in the directory you
installed the files in or unzipped them to.
When you open it the first time, the Active Console displays the Select Workspace screen:
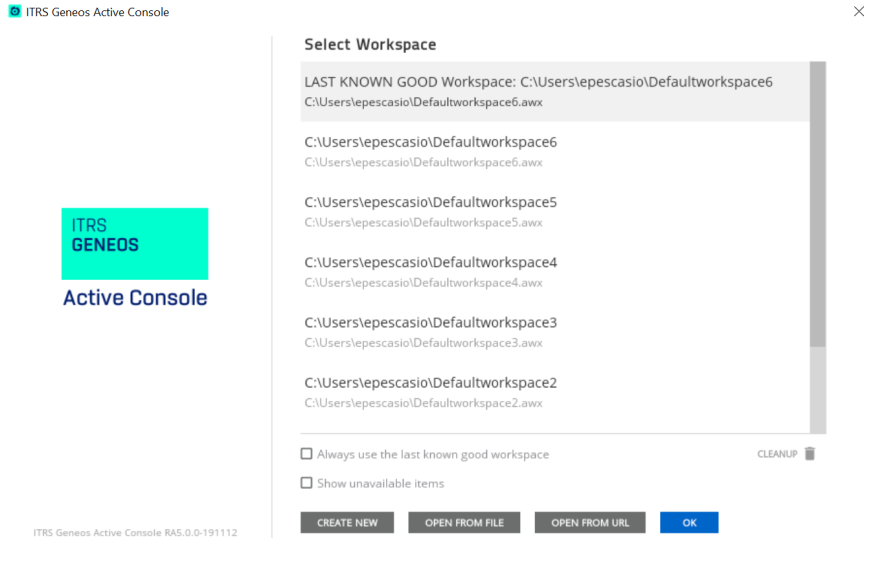
To know more about workspace, see Workspace Selection.
Creating a new workspace displays the default dockables:
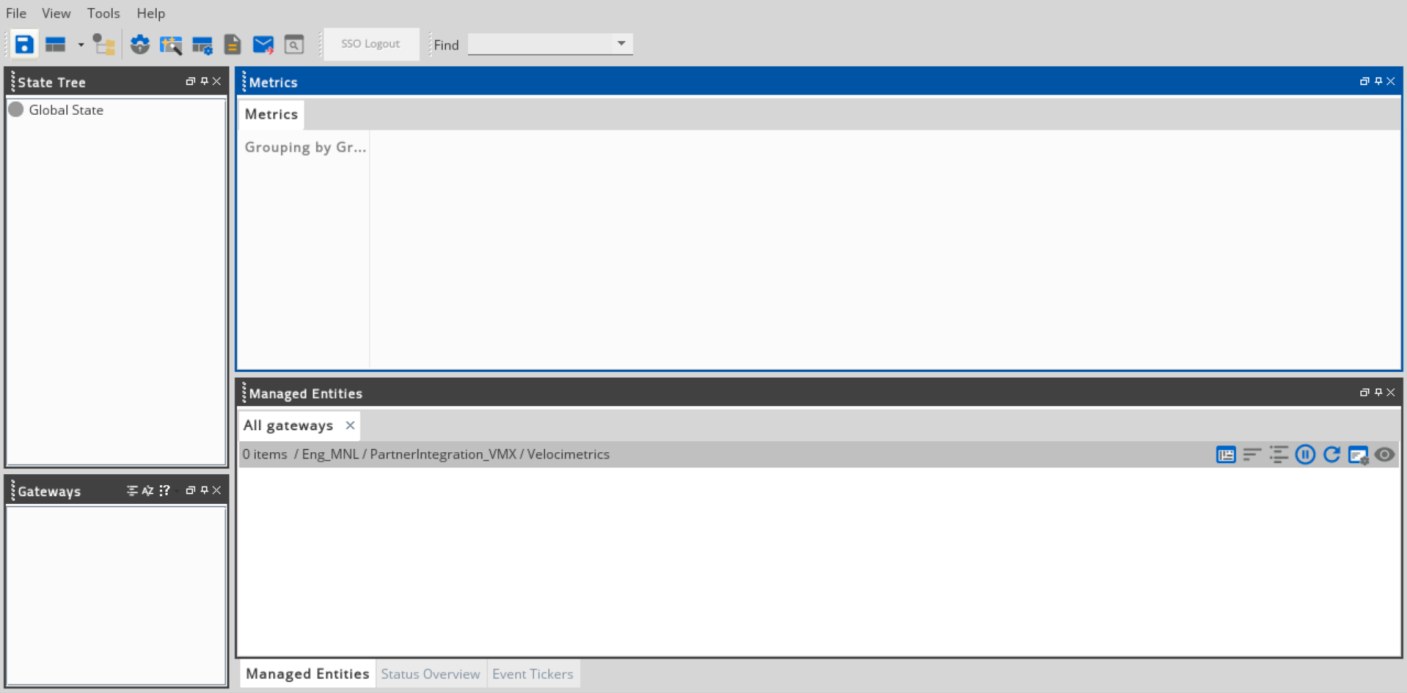
Menu bar
The Menu bar contains the File, View, Tools, and Help buttons.
File menu bar
The main application level File menu bar has the following functions:
| File menu | Description |
|---|---|
| Configure Gateway |
Displays the list of all other Gateways that you are connected to. Selecting one of the Gateways from the list opens the Gateway Setup Editor. |
| Connect to all Gateways |
Enables all Gateways. |
| Disconnect from all Gateways | Disables all Gateways. |
| Workspace |
Lists the names of workspaces you have previously used. A sub-menu that contains the following options:
|
| Import | Imports a component from the source file. |
| Exit | Gives you the option to save your workspace, and then closes the Active Console. |
View menu bar
The main application level View menu bar have the following functions:
| Name and Icon | View menu | Description |
|---|---|---|
| Layout | Layout |
Lists the names of workspaces you have previously used. A sub-menu that contains the following options:
|
| Show/Attach all windows |
Displays all active windows, and all detached windows return in the workspace.
|
|
State Tree

|
State Tree | Displays the State Tree component if it is hidden or closed. |
Gateways

|
Gateways | Displays the Gateways component if it is hidden or closed. |
Event Tickers |
Event Tickers | Displays the Event Tickers component if it is hidden or closed. |
|
Output |
Output | Displays the Output Dockable component if it is hidden or closed. |
Metrics

|
Metrics | Displays the Metrics component if it is hidden or closed. |
Search Results

|
Search Results | Displays the Search Results component if it is hidden or closed. |
Commands |
Commands | Displays the Command component if it is hidden or closed. |
Paths |
Paths | Displays the Paths dockable if it is hidden or closed. |
Managed Entities

|
Managed Entities | Displays the Managed Entities component if it is hidden or closed. |
Active Dashboard

|
Active Dashboard | Displays the Active Dashboards component if it is hidden or closed. |
| Status Overview | Displays the Critical and Warning (Under Selection), Netprobe Issues, and Sampling Errors. | |
Dockable Manager

|
Dockable Manager | Allows access to the Dockable Manager screen. |

Tools menu bar
The main application level Tools menu bar has the following functions:
| Name and Icon | Tools menu | Description |
|---|---|---|
Settings |
Settings | Describes the configuration settings of the current workspace. |
Create Metric Overview |
Metrics Overview | Allows you to quickly create a metrics overview. |
Search |
Search | Defines a search over the data items. |
Reporting |
Reporting | Opens the Reports component. |
Notifier Manager

|
Notifier | Launches the Notifier screen. |
Time Definitions

|
Time Definitions | Opens the Time Definition Manager screen. |
Workspace level Listview Settings

|
Workspace level Listview Settings | Allows you to define the settings used by all the list views in the workspace. |
Gateway Setup Editor

|
Gateway Setup Editor | Launches the Gateway Setup Editor (GSE). |
Table Column Settings Editor

|
Table Column Settings Editor | Displays the workspace level column settings models. |
| Path Editor | Path Editor | Allows access to the path editor. It has the DataItem Path Editor or the Geneos URL Editor as option. |
Refactor Paths

|
Refactor Paths | Opens the Refactor Tool screen. |
| Custom Modifiers Manager | Custom Modifiers | Allows you to supplement the hard-coded modifiers that exist in the workspace with your own custom modifiers. |
| Show all windows | Show all windows | Displays all active windows or screen connected to Active Console. |
Help menu bar
The main application level Help menu bar has the following functions:
| Help menu | Description |
|---|---|
| Get started with Active Console | Launches the onboarding screen for Active Console. |
| Geneos Online Documentation | Directs you to the Resources online documentation site to access the Geneos' User Guide, Technical Reference, and How to guides. |
| View Diagnostics Page | Displays the Orb Diagnostic Mode in a new browser. |
| Create Diagnostics File | Creates a diagnostic file that can be used by ITRS Support in case of any technical problems. |
| About |
Launches the Geneos Active Console screen with version information. |
Toolbar
The Toolbar displays the commonly used functions in Active Console:
| Name and Icon | Name and Icon | Description |
|---|---|---|
Save |
Save the workspace
|
Saves the current workspace. |
Workspace History |
Workspace History
|
Displays recently accessed workspaces. If the file name is already greyed out, then it is not accessible. |
| State Tree
|
State Tree
|
Displays Gateways and their directory components in a hierarchical structure. You can choose between a physical view (Gateway/Netprobe) or a logical view (ordered by Managed entity metadata) to display the lists. |
| Configure Gateway |
Configure Gateway
|
Opens the Configure Gateway screen that lists all active and connected Gateways to your Active Console. From this list, you can configure the selected Gateway through Gateway Setup Editor. |
| Metrics Overview |
Metrics Overview
|
Allows you to easily create a metrics view by selecting the sampler available in your Gateway. |
| Workspace Settings |
Workspace Settings
|
Opens the Active Console settings. |
| Reporting Tool |
Reporting Tool
|
Launches the Reports screen. |
| Notifier Manager |
Notifier
|
Displays the Notifier Manager screen. |
| Search for data items |
Search
|
Defines a search over the data items. |
| SSO Login/Logout | SSO Login/Logout | Connects and disconnects to SSO. |
| Find | Find | Search a term in the current workspace. |
Configure your workspace
Once you are familiar with the Active Console interface, here are a few things you can do:
Customise your dockable layout
Active Console user interface uses a docking component that allows you to customise its layout. This section walks you through the steps on how to move, combine, collapse, and unhide a dockable.
For more information, see Customise a Dockable.
Configure the Active Console settings
The Workspace Settings allows you to configure the settings of the current workspace. This includes the following settings:
- General
- Connection
- Database
- Gateway Hub
- System Tray
- Tooltips
- Advanced
Select your workspace
When you start up the Active Console, it allows you to select the workspace that you want to use. The Workspace Selection presents some standard workspace options, and a list of the recent workspace files that you have used. You can also see the common errors that you may encounter.
Display and execute commands
To view the list of the recent and currently executing commands, see Commands Dockable.
To display the results of commands that generate output, see Output Dockable.
Create your own dashboard
You can create your own dashboard in Active Console. For more information, see Introduction to Active Dashboard.
Advanced features
This section walks you through the advanced configurations and operations that the Active Console is capable of. You can follow the instructions that include detailed help for you to customise the settings, list views, dockables, and other configurations:
Configure the list view
This section can help you display all the critical managed entities connected to Gateway, all data items that are snoozed, and all data items that are assigned to a user. Also, to know more about the list view settings hierarchy and workspace level list view, see List View.
Configure the table settings in the Metrics view
To configure the table settings in the Metrics view, see Table Column Settings Editor in Metrics Dockable.
Edit Geneos URL and data item paths
The Path Editor allows you to modify the Geneos URL and data item paths. For more information, see Path Editor.
Evaluate the XPaths
A path's score represents how expensive an XPath is, or how long it takes for the Active Console to evaluate the XPath. To know more about the element paths, see Evaluate Paths and Scoring.
Import historical events from database
The Active Console is capable of retrieving events and chart data from database. For more information, see Import historical events from database in Event Tickers Dockable.
Manage your dockables list
To display and manage the list of all dockables in your workspace, see Dockable Manager.
Search data items
To define a search over all the data items known the Active Console, see Search Function and Search Dockable.
Schedule queries to take snapshots
The Reporting Tool provides information on how to schedule queries that can take snapshots of the system state.
Further reading
Here is the list of changes in the buttons, components, and functions beginning with Active Console 5.0:
| Before version 5.0 | Beginning with version 5.0 |
|---|---|
| File > Workspace > Workspace History > Select Workspace | Workspace History on the Toolbar > Select Workspace |
| Tools > Create Metric Overview | Tools > Metrics Overview |
| Tools > Notifier Manager | Tools > Notifier |
| Tools > Custom Modifier Manager | Tools > Custom Modifiers |
| Select Workspace > Create a new workspace | Select Workspace > Create New |
| Select Workspace > Browse for a workspace | Select Workspace > Open From File |
| Select Workspace > Open workspace from url | Select Workspace > Open From URL |
| View > Geneos Architecture Health | View > Status Overview Status Overview only displays if a new workspace is created. Otherwise, the Active Console displays the former Geneos Architecture Health and Items of interest dockable. Status Overview also contains the tabs for:
|
| View > Paths dockable | Tools > Evaluate Paths |
| Tools > Re-factor paths > Refactor Tool | Tools > Refactor Paths |
| Tools > Custom Modifier Manager | Tools > Custom Modifiers |
| Active Dashboard > Active Chart | Active Dashboard > Line Chart |