If you are currently using version 5.x.x, we advise you to upgrade to the latest version before the EOL date. You can find the latest documentation here.
Modifiers
Overview
Modifiers are settings which update the dashboard based on the changes in the Gateways that are being monitored. Modifiers can affect the following:
- Fill colour based on severity of a data item.
- Border colour based on the severity of a data item.
- Text based on the name of a data item.
- Text based on the value of a data item.
- Picture based on the icon of a selected data item.
- Replace the URLs in the dashboard object to point at the data item (this replaces all existing URLs, not add to them).
You can still edit the object's attributes through its Properties dialog. For more information, see Configure basic shape properties in Active Dashboard Palette.
Add modifiers
To add a modifier into a dashboard object:
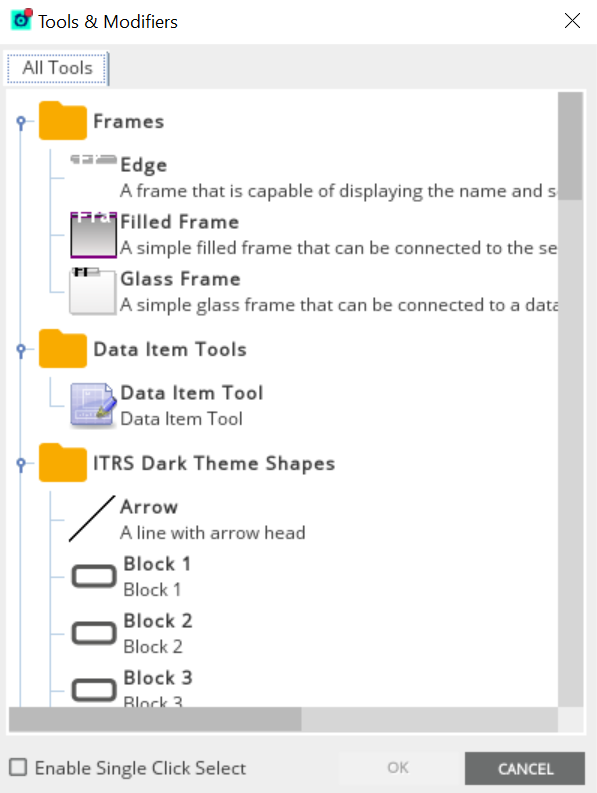
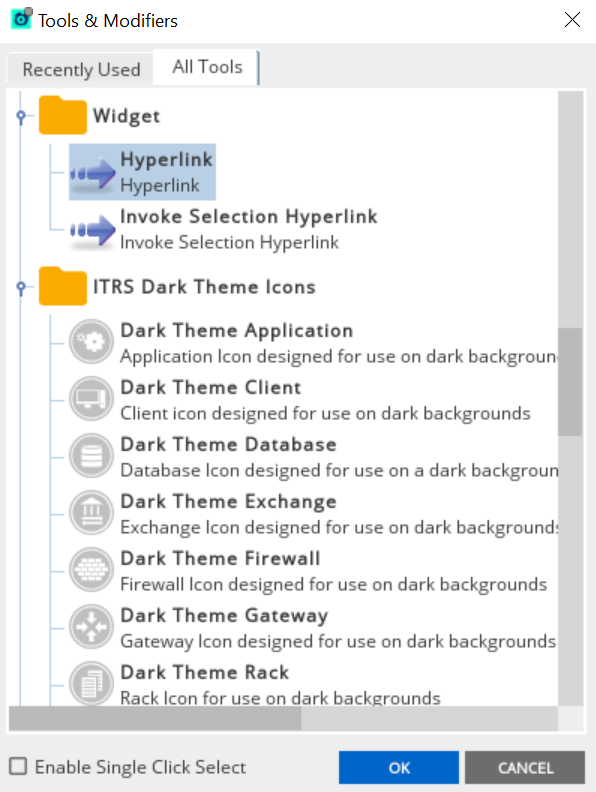
- Drag and drop the selected data item, such as entities from the State Tree and data items from the Metrics view, into the desired object. This opens the Tools & Modifiers dialog.
- Select the modifier on the All Modifiers tab.
- Click OK.
If you have used the modifiers recently, then it appears on the Recently Used tab. There are two ways to see what modifiers are set up in a dashboard object:
- Tooltips — hover the selected dashboard object and the tooltip displays the detail of the modifiers that are currently acting on it.
- Properties dialog.
You can modify the data items that a modifier reacts to by changing the path in the properties dialog:
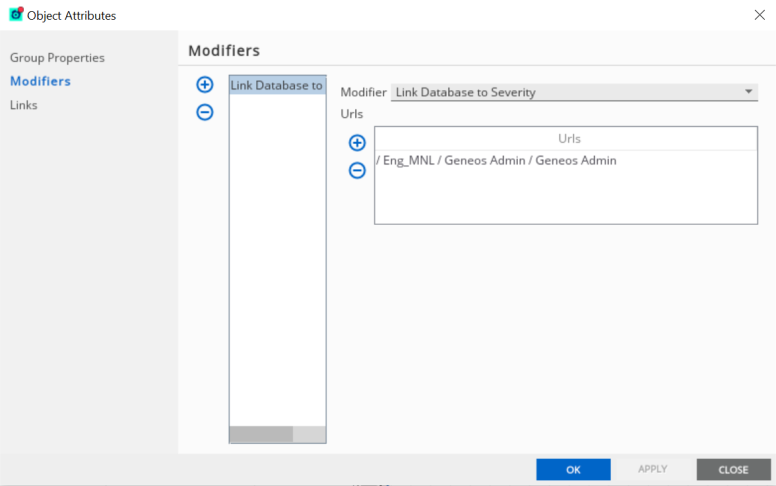
Wildcards can be used to modify the path. To know more about editing the object's path, see Path Editor.
Checking and updating a modifier on its own is not an expensive operation, but if you have dozens (or even hundreds) of modifiers, you may notice a higher CPU requirement on your local machine. You can change the rate at which modifiers evaluate in the advanced settings of the workspace.
Note: The dashboard refresh rate (in seconds) determines how long the dashboard should wait before it re-evaluates the modifiers. This means that the information on the dashboard could be up to number of seconds old, where X is your selected setting value. To modify the refresh rate, see Advanced settings in Workspace Settings.
Use Custom Modifiers
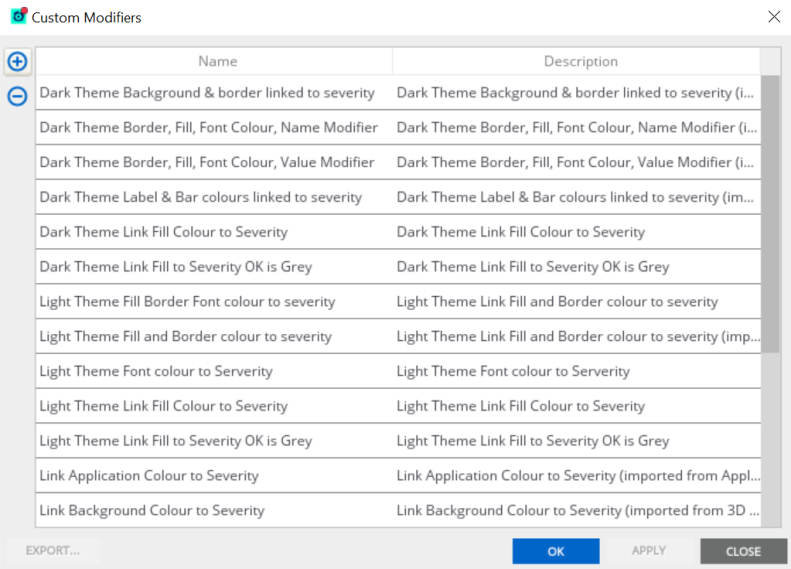
The Custom Modifiers allows you to modify the hardcoded modifiers that exist in the workspace with your own custom modifiers.
Modifiers link a property of a data item, such as an entity, probe, dataview, cell or headline, to a property of a dashboard object. These are contained as part of the workspace. The Active Console comes with a number of predefined modifiers, but you can also create your own using the Custom Modifiers.
To open this function, go to Active Console > Tools > Custom Modifiers.
All data items which match that path contribute to the effect of the modifier. If the path matches nothing, then the default value defined on the modification is used.
To create your own modifier:
- Open Custom Modifiers.
- Click Add
 .
. - Select a value for each field:
- Data item property.
- Dashboard object property.
- Default value.
- Rules, if applicable.
This opens the Modifier Editor dialog:
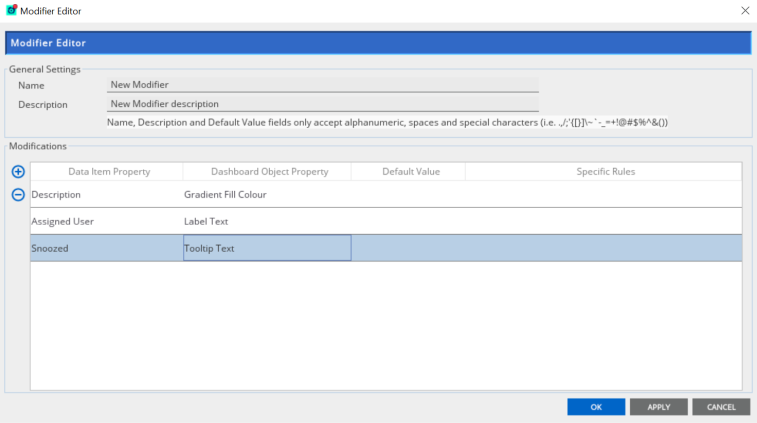
Note: When you click OK, the new modifier automatically adds on the All Modifiers tab.
You can modify the following data item properties:
| Data item property | Data item type | Effective type |
|---|---|---|
| Name | Any | String |
| Group | Any | String |
| Description | Any | String |
| AssignedUser | Any | String |
| Severity | Any | Int |
| Active | Any | Boolean |
| Snoozed | Any | Boolean |
| DatabaseLogging | Any | Boolean |
| UserAssigned | Any | Boolean |
| ID | Gateway | Int |
| Gateway.PrimaryHost | Gateway | String |
| Gateway.PrimaryPort | Gateway | String |
| Gateway.LogonDetails | Gateway | String |
| HostName | Probe | String |
| Port | Probe | Int |
| ConState | Probe | String |
| RejectionReason | Probe | String |
| RejectionMessage | Probe | String |
| OS | Probe | String |
| Version | Probe | String |
| Support | Probe | String |
| AssignedUser | Any | String |
| Type | Sampler | String |
| PluginName | Sampler | String |
| SampleInterval | Sampler | Int |
| AssignedUser | Sampler | String |
| OverviewType | Dataview | String |
| SampleTime | Dataview | Int |
| Value | Cell or Headline | Variant |
You can modify the following dashboard object properties:
| Dashboard object property | Dashboard object type | Effective type |
|---|---|---|
| SIZE_HEIGHT | Group or Polygon | Float |
| SIZE_WIDTH | Group or Polygon | Float |
| POSITION_X | Group or Polygon | Float |
| POSITION_Y | Group or Polygon | Float |
| FILLED | Polygon | Boolean |
| FILL_COLOUR | Polygon | Colour |
| FILL_TRANSPARENCY | Polygon | Float (0..1) |
| VISIBLE_BORDER | Line or Polygon | Boolean |
| BORDER_COLOUR | Line or Polygon | Colour |
| BORDER_THICKNESS | Line or Polygon | Float |
| BORDER_STYLE | Line or Polygon | Int |
| BORDER_TRANSPARENCY | Line or Polygon | Float (0..1) |
| TOOLTIP_TEXT | Any | String |
| LABEL_TEXT | Any Polygon | String |
| LABEL_FONT_SIZE | Any Polygon | Int |
| LABEL_FONT_COLOUR | Any Polygon | Colour |
| LABEL_CLIP | Any Polygon | Boolean |
| LABEL_BUFFER | Any Polygon | Float |
| LABEL_HORIZ_ALIGN | Any Polygon | Int |
| LABEL_VERT_ALIGN | Any Polygon | Int |
| PICTURE_STRETCH | Picture | Boolean |
| REPLACE_URLS | Any | String |
| ROTATE | Any | Float |
| GRADIENT_FILL_COLOUR | Any Polygon | Colour |
Allowable mappings are:
| Data Item Property Type | Allowed Dashboard Object Property Types |
|---|---|
| String | String |
| Int | Float, Int, String |
| Boolean | Boolean, Colour, String |
| Variant | Boolean, Float, Int, String |
| Severity | Colour |
Expected values for modifiers
For some of the dashboard object properties, it may not be immediately obvious what values you need to set to get the desired effect, or even what values are allowable.
The following are the expected and allowable values for each property:
Export and import modifiers
To export one or more modifiers:
- Go to Tools > Custom Modifiers.
- Select one or more modifiers from the list.
- Click Export.
- Enter the file name.
- Select a location on your local machine.
- Click OK.
To import a modifier in your workspace:
- Go to Active Console > File > Import.
- Select the modifier from your local machine.
- Click Open.
You can only import one modifier file at a time, although that file may contain many modifiers.
Note: It is recommended that you avoid having modifiers with the same name in the same workspace. This can cause confusion and potentially cause unpredictable operation of the dashboard. If there is an issue during the import, then a dialog detailing the problem appears.
Hyperlink in the dashboard
You can set up hyperlinks on dashboard objects which can go to:
- Data items — you can link to a specific data item. This activates the link to open the most relevant dockable and change its contents to display the relevant data item. Linking it to a managed variable reconfigures and displays the dataview in the primary Metrics view dockable. However, when you click a dashboard object with an XPath URL that is not linked to a specific data item, the dataview displays in the Search Results dockable
Note: The path should be the full XPath to the data item, not the user readable version. This link follows this format: geneos://ac/dataitem//pathToDataItem
- Other Dockable components of Active Console and follow the form: geneos://ac/dockablename
- Individual tabs within dockable components — this includes other dashboards and follows the form : geneos://ac/dockablename/tabname
- Conventional URLs — a web browser opens and be directed to the specified URL.
Configure hyperlink of the object
There are two main ways of adding links in the dashboard:
- Open the object's properties dialog and click Link.
- Drag and drop a data item into the selected object and use the
 Hyperlink or Invoke User Hyperlink on the All Tools tab.
To edit a URL, you can either type or enter the URL into the relevant row in the table or you can use the Path Editor. See Path Editor.
Below is another use case that you can do when setting up a hyperlink on the dashboard objects.
Link an Active Dashboard to another dashboard
To link an Active Dashboard to another dashboard, you can either set the configuration in the Properties > Links or open Object Inspector:
- Go to Active Dashboard in the Active Console.
- Create at least two tabs so you can choose where you want to link your existing dashboard.
- Drag an object into the dashboard canvas.
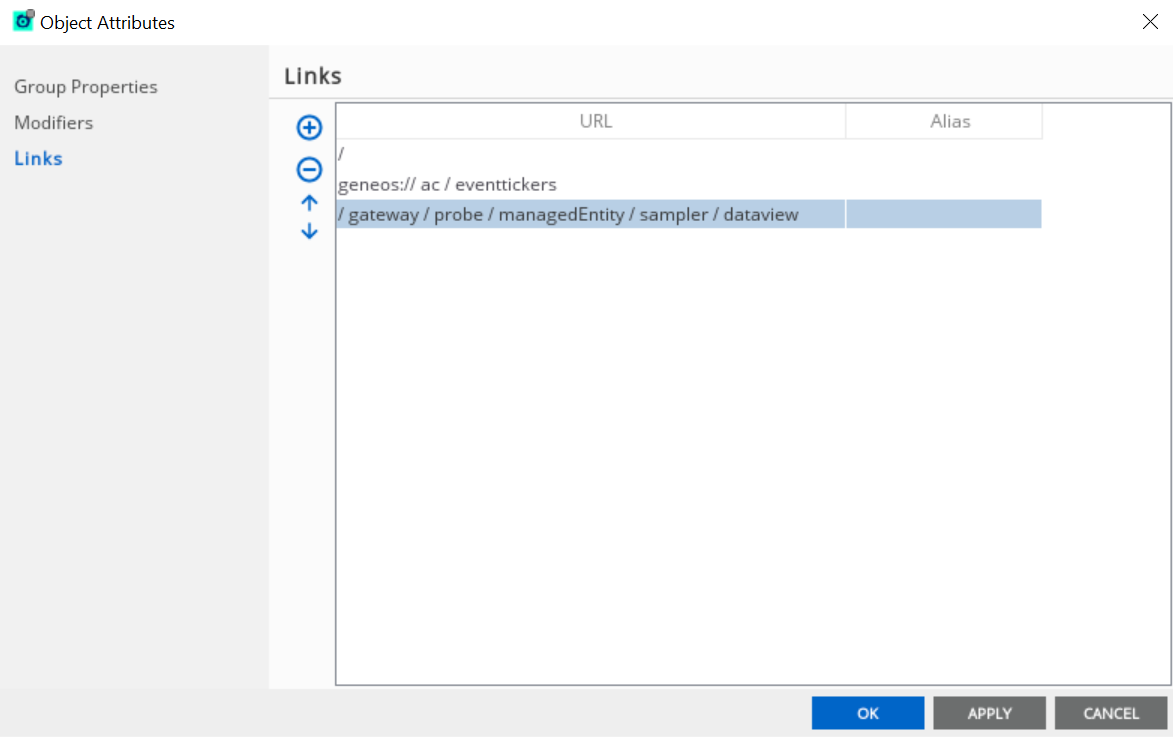
- Open Object Inspector.
- In the Links section, click Add. This allows you to define a URL.
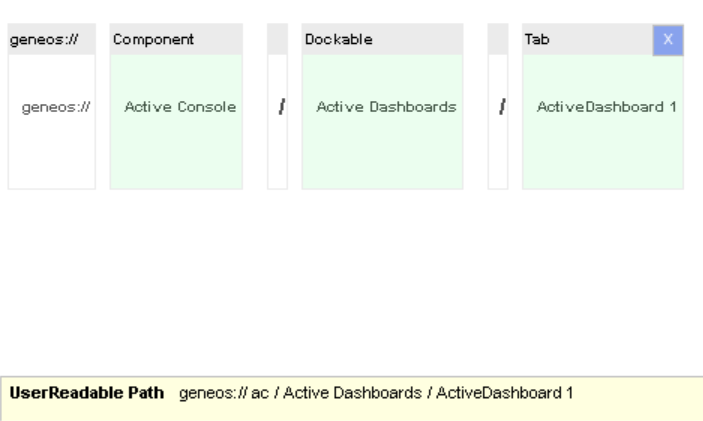
- Click the ellipsis button next to the Undefined URL. This opens the Path Editor.
- Drag and drop the Component, Dockable, and Tab elements in the work area of the editor.
- Select Active Console on the Component element.
- Select Active Dashboards on the Dockable element.
- Select the dashboard name where you want to link your dashboard on the Tab element.
- Click OK.
- Right-click the object and click Links to open another dashboard. Alternatively, double-click the object.
Invoke links on dashboard objects at the same time
Links can be defined on dashboard objects through their properties dialog.
A dashboard object can have zero to many links. Prior to this, if you double-click the dashboard object with one to many links, then the first link will be invoked.
You can right-click the dashboard objects, and select the Links menu which expand allowing you to invoked a selected link. This allows you to invoke multiple links when you double-click the dashboard object.
In the end of the first URL, add an accessor to this link. This path:
dataitem(/geneos/gateway/directory/probe/managedEntity)
becomes:
dataitem(/geneos/gateway/directory/probe/managedEntity)/?(InvokeNextlink)
When the Active Console invokes a link from the dashboard, it look for the next link, then invoke that as well until it runs out of links, or finds one without the InvokeNextLink accessor.
Note: The path editor contains an accessor tool where the invoke next link is an allowable value.
The search results tab get populated with all entities, and the result replaced with all samplers. A search tab appears for the entities, and then a new (second) tab for all samplers. You must manually closed the search results because these are not persisted in the workspace.
Invoke links on dashboard objects to handle multiple XPaths
When a set of links on a dashboard object points at individual dataview, it can invoke each one using the InvokeNextLink function in the existing system. However, this overwrites the changes in the Primary Metric view. It is not possible to bring up all the dataviews. If this is what is intended, use the InvokeNextlink with an additional argument:
/?(InvokeNextlink(Temp))
The Temp argument tells the Active Console to show the dataview on its own window, rather than replacing the Primary Metric overview. This shows multiple disjoint dataviews by clicking the dashboard object.
Note: The paths to the dataviews must be fully qualified for them to work. The Temp window has the Dockable Manager 'Temp' flag set so that when it is closed, it will be removed from the dockable set and not saved to the workspace.
dataitem(/geneos/gateway[(@name="TRAINING_LAB_544823731")]/directory/probe[(@name="np_lab1")]/managedEntity[(@name="TRAINING1")]/sampler[(@name="CPU")][(@type="Infrastructure Defaults")]/dataview[(@name="CPU")])
Convert to list view dockable
When a link is invoked in the Active Dashboard or through the Search function in the Active Console, the results go to the search window as specific named tag. This allows you to create a new list view tab, including the specific location for the new list view.
- Right-click the tab you want to convert.
- Click Convert to List View.
- Click New Dockable on the Select Target dialog.
- Click Import.
Invoke user selection events from the dashboard
This allows you to invoke the user selection events from the dashboard directly, not only by using the state tree or list view dockable. When the link is invoked by a single, double-click on the dashboard object, or through the right-click menu, it simulates an action on that the specified data item.
In the example below, it is named as managed entity. This allows you to create selection panes in a dashboard, which when combined with follow selection paths, allows dashboards to be reconfigured by selecting other dashboard objects:
invokeuserselection(/geneos/gateway[(@name="TRAINING_LAB_544823731")]/directory/probe[(@name="Virtual Probe")]/managedEntity[(@name="TRAINING_LAB")])/
These hyperlinks can be added manually in the Path editor. You can also add them by dragging and dropping the data item in the interface, such as list view and state tree. Selecting the Invoke user Selection Hyperlink tool corrects the hyperlink.
Use the InvokeNextLink function to join together a follow selection event with a navigation to another tab. For example, add the following links:
invokeuserselection(/geneos/gateway[(@name="TRAINING_LAB_544823731")]/directory/probe[(@name="Virtual Probe")]/managedEntity[(@name="TRAINING_LAB")]))/?(InvokeNextlink)
geneos://component(ac)/dockable(Active Dashboards)/tab(Detailed Dashboard)
It is expected that you may not always want a dashboard to update based on the user selection event for dashboards. Filters can be added to the UserSelection paths to stop events being followed when paths do not match a filter. For example:
geneos://component(ac)/userselection(//managedEntity)
Invoke data item commands from the dashboard
This allows you to add hyperlinks to the dashboard objects that invoke user commands on data items, such as snooze, sample now, or restart probe.
Use the syntax:
/?(Command(/SNOOZE:manualAllMe,,1,manual,0,this))
Note: Active Console does not display any warning or error messages if the command or its parameters are incorrect. To avoid this, always check and ensure their commands syntax during configuration. Also, setting a password argument in the command sends the value as plain text only.
In the example below, the data items are specified. If the dashboard properties prohibit the selection of objects, a single click invokes the link:
dataitem(/geneos/gateway[(@name="TRAINING_LAB_544823731")]/directory/probe[(@name="np_lab1")]/managedEntity[(@name="TRAINING1")]/sampler[(@name="CPU")][(@type="Infrastructure Defaults")]/dataview[(@name="CPU")])/?(Command(/SNOOZE:manualAllMe,,1,manual,0,this))