If you are currently using version 5.x.x, we advise you to upgrade to the latest version before the EOL date. You can find the latest documentation here.
- Reference Guide
Introduction
The is a widely used platform for core-banking and wealth and retail systems. It is the current version of the operating system previously called , and originally named when it was introduced with the computer system.
Geneos has the capability to monitor the remotely using the JTOpen library, which is the open-source version of the IBM Toolbox for Java, and is a library of Java classes that allows access to resources. The JTOpen library is included with the version of the Netprobe.
The following plug-ins for the are available:
- System — shows metrics on CPU, Hardware, and Disk
- Pool — shows metrics on storage pools for a system
- Subsystem — shows metrics on subsystems within a system
- Job — shows metrics on jobs running on the system
- Queue — shows metrics on message queues for a system
- Message — shows metrics on messages within a queue
- Log Reader — generates streams from logs for consumption by other plugins, such as FKM and State Tracker plugins.
Note: Beginning Geneos 5.3.0, the Log Reader is available to send the contents of IFS log files into a stream.
Prerequisites
The following are the requirements for running the Geneos plugins:
-
machine running a Netprobe.
-
Java runtime environment
- The plugin must be able to connect to a Java application. For guidance, see Configure the Java environment.
- A TCP/IP connection to an server. The server must have the following:
- Server must be , , or V4R3 or higher.
- Server must have the Option 12 host servers installed and running. JTOpen uses the host servers as TCP/IP endpoints to communicate with the server from a client.
- Server must be able to accept connections on ports 8470, 8473, 8475, 8476, and 449. These are the defaults used by the server. If you use non-default ports, make sure those are open to accept connections.
For more information on supported versions, see Operating system support in 5.x Compatibility Matrix.
The following are the views for the plugin:
| Name | Description |
|---|---|
| CPU | A view showing CPUs being used by the system/partition. |
| Disk | A view showing the disk status of the system. |
| Hardware | A view showing the major operating system and hardware resource settings for the . |
| Job | A view showing server jobs. |
| Log Reader | Shows the status of streams generated by the Log Reader plugin. |
| Message | Shows the messages for a configured message queue. |
| Pool | A view showing the storage pools for the system. |
| Queue | A view showing message queues (MSGQ) for the system. Message queues are used for system and program messages for the operator. |
| Subsystem | subsystems are an operating environment, defined by a subsystem description, where the system coordinates processing and resources. |
Sampler configuration
This section lists down configuration items common for all views, as each view is run by a separate sampler.
Caution: When you update the configuration of certain Java-based plug-ins, including this one, the Netprobe running it has to restart. Be aware of other potentially unrelated plug-ins that can be affected when you configure this particular plug-in.
connection > systemName
Defines the system being monitored by the sampler. This can be either an IP address or the actual system name.
Mandatory: Yes
System view
The System View combines CPU, Hardware and Disk.
CPU View
This view shows CPUs being used by an system/partition.

Headline legend
| Name | Description |
|---|---|
| system | The system name. |
Table legend
| Name | Description |
|---|---|
| currentProcessingCapacity | The amount (in number of physical processors) of current processing capacity of the partition. For a partition sharing physical processors, this attribute represents the shares of the physical processors in the pool it is executing. |
| percentCurrentInteractivePerformance | The percentage of interactive performance assigned to the logical partition. |
| percentDBCapability | The percentage of processor database capability that was used during the elapsed time. |
| percentProcessingUnitUsed | The average of the elapsed time during which the processing units were in use. For an uncapped partition, this is the percentage of the configured uncapped shared processing capacity for the partition that was used during the elapsed time. This percentage could be greater than 100% for an uncapped partition. |
| percentSharedProcessorPoolUsed |
The percentage of the total shared processor pool capacity used by all partitions using the pool during the elapsed time. -1 is returned if this partition does not share processors. |
| percentUncappedCPUCapacityUsed | The percentage of uncapped shared processing capacity for the partition that was used during the elapsed time. |
| processors | Number of processors that are currently active in this partition. |
| processorSharingAttribute |
Indicates if the partition is sharing processors.
0 - does not share processors
1 - shares processors (capped - limited to
using configured capacity)
2 - shares processors (uncapped - can use
more than its configured capacity).
|
Disk view
The Disk View monitors disk usage. In the , a disk is represented by an auxiliary storage pool (ASP). An ASP is a software definition of a group of disk units on the system. This means that an ASP does not necessarily correspond to the physical arrangement of disks.

Headline legend
| Name | Description |
|---|---|
| system | The system name. |
Table legend
| Name | Description |
|---|---|
| unit | Disk unit number. This is a unique identifier for each non-mirrored unit or mirrored pair among the configured disk units. Both mirrored units of a mirrored pair have the same disk unit number. The value of the disk unit number is assigned by the system when the disk unit is assigned to the ASP. |
| name | The resource name - the unique system-assigned name of the disk unit. |
| type | The type of disk unit. |
| freeSpace | Disk storage available. The number of MB of space not currently assigned. |
| percentageUsed | Percentage of disk used. |
| totalSpace | Disk capacity. The total size of the disk unit in MB. |
| percentageBusy |
Percentage of disk busy. This is calculated based on: (sampleCount - notBusyCount) / notBusyCount, where:
This is the same as the %busy column in WRKDSKSTS (Work with Disk Status). |
Hardware view
The Hardware View provides major operating system and hardware resource settings of an host.

Table legend
| Name | Description |
|---|---|
| os | Details of the operating system of the host. For example, 6.1.0 where Version = 6, Release = 1, Modification = 0. |
| countryID | Country identifier. Example: US. |
| system | The system name. |
| languageID | Language identifier. Example: ENU. |
| mainStorageSize |
This is the total RAM in the system, in MB, which is represented by main storage size in the . Note: On a partitioned system, the main storage size can change while the system is active. |
| processorFeature | This number identifies the processor which is part of the computer system that operates on data. |
| systemModel | The model number of the system. Example: MHB, which is a Power 780. |
| systemSerialNumber | This is the seven-digit number that uniquely identifies the System i. |
| timezone | The timezone code, eg. BST(+0100). |
| totalActiveJobs | This is the number of jobs active in the system (jobs that have been started, but have not yet ended), including both user and system jobs. |
| totalJobs |
This is the total number of user and system jobs that are currently in the system. This includes:
|
| uptime | Elapsed time in days since the last IPL (Initial Program Load) / system reboot. |
Job view
This view shows server jobs. Jobs are the basic unit of work on the . Additional "cpu" statistics can be obtained by enabling this in the configuration.
Note: Enabling cpu statistics will increase data collection time due to additional JTOpen calls in the background. If cpu statistics are enabled, we recommend using filters to limit the number of rows returned in the dataview.
Here is the view with cpu statistics switched off:

Here is the view with cpu statistics switched on:

Headline legend
| Name | Description |
|---|---|
| system | The system name. |
| totalJobs | The total number of user and system jobs in the system. |
| totalActiveJobs | The number of active jobs in the system, including both user and system jobs. |
| maxJobs | The maximum number of jobs allowed on the system. |
| totalBatchJobs | The number of batch jobs currently running on the system. |
| jobsMatchingFilter | The number of jobs that matched filter criteria. |
| jobsMaxRows | The number of rows that is set in the max rows setting. |
Table legend
| Name | Description |
|---|---|
| key | Job name/job number. For example, ADMIN/000294. |
| name | The job name. |
| number | The job number. For example, 000294. |
| user | The user name. For example, QWEBADMIN. |
| type |
The job type. Possible values are:
|
| status |
The job status. Possible values are:
|
| activeJobStatus |
The active job status. This is the active status of the initial thread of the job. There are many active job statuses designated by a 4-letter code. A blank status field represents a job that is in transition or is not active. Some examples:
|
| statusInQueue |
The status of the job on the job queue. Possible values are:
|
| subsystem | The subsystem in which the job is running. |
| priority | The priority at which the job is currently running, relative to other jobs on the system, ranges from 0 (highest) to 99 (lowest). |
| endReason |
This is the job end reason, which only has a value if the job was already ended. Possible values are:
0: Job not ending.
1: Job ending in a normal manner.
2: Job ended while it was still on a job queue.
3: System ended abnormally.
4: Job ending normally after a controlled end was requested.
5: Job ending immediately.
6: Job ending abnormally.
7: Job ended due to the CPU limit being exceeded.
8: Job ended due to the storage limit being exceeded.
9: Job ended due to the message severity level bein exceeded.
10: Job ended due to the disconnect time interval being exceeded.
11: Job ended due to the inactivity time interval being exceeded.
12: Job ended due to a device error.
13: Job ended due to a signal.
14: Job ended due to an unhandled error.
|
| jobEnteredDate | The date the job entered the system. |
| jobEnteredTime | The time the job entered the system. |
| jobStartDate | The start date for the job. |
| jobStartTime | The start time for the job. |
| jobEndDate | The end date for the job, if available. This value is for jobs whose status is JOBQ or ACTIVE. For jobs with a status of OUTQ, the value for this field is blank. |
| jobEndTime | The end time for the job, if available. This value is for jobs whose status is JOBQ or ACTIVE. For jobs with a status of OUTQ, the value for this field is blank. |
| timeElapsed | The elapsed time for the job. This is the difference between the start datetime and the end datetime or the datetime of the current sample, if the job does not yet have an end datetime. Depending on the actual time elapsed, this field will be displayed in the format <dddd:hh:mm:ss>. |
| totalCpuUsed |
The total amount of processing time (in ms) that the job used. Note: This field will not be displayed if enableCpuStatistics is set to false. |
| cpuPercentElapsed |
Processing unit used by the job - in percent during the elapsed (sampling) time. Note: This field will not be displayed if enableCpuStatistics is set to false. |
| cpuTimeElapsed |
Processing unit used by the job in ms - time during the elapsed (sampling) time. Note: This field will not be displayed if enableCpuStatistics is set to false. |
Job configuration
Caution: When you update the configuration of certain Java-based plug-ins, including this one, the Netprobe running it has to restart. Be aware of other potentially unrelated plug-ins that can be affected when you configure this particular plug-in.
Note: All filters in this plug-in use Java Regular Expressions.
filters > jobName
This will filter the dataview to include only jobs matching a regex or a list of jobs.
filters > useRegexForJobName
If set to true, the jobname filter will use a Java regex as indicated in the Javadoc for java.util.regex.Pattern.
If set to false, the jobname filter will expect a list of specific and generic jobnames separated by the pipe symbol. A generic jobname is indicated by a prefix, followed by an asterisk. Example lists of jobnames are:
- QSERVER
- QSERVER|QCTL
- QSERVER|QU*|QCTL|QT*
- Q*
When using a list of jobnames (instead of a regex filter), queries into the IBMi are more specific and relatively faster (compare to using a regex filter for jobnames, which will query for all jobnames and apply the regex on the results). If the list of jobnames doesn't include valid specific/generic jobnames, or isn't separated by | symbols, it will be treated as a regex instead.
filters > jobStatus
This will filter the dataview to include only jobs based on the job status. Possible values are:
- ACTIVE
- JOBQ - job currently on a job queue
- OUTQ - completed running but still has output on an output queue
filters > jobSubsystem
This will filter the dataview to include only jobs being run on the specified subsystem.
Note: This filter works by regex. If the subsystem filter has a value and enableCpuStatistics is false, then the subsystem filter will be ignored.
filters > jobType
This will filter the dataview to include only jobs with the specified type. For example, BATCH will filter only batch jobs. Possible values are:
- AUTOSTART
- BATCH
- INTERACTIVE
- SCPF_SYSTEM
- SPOOLED_READER
- SPOOLED_WRITER
- SUBSYSTEM_MONITOR
- SYSTEM
filters > jobUser
This will filter the dataview to include only jobs matching the configured job user name.
Note: This filter works by an exact match but is not case sensitive.
filters > maxRows
The maximum number of rows that will appear on the dataview.
enableCpuStatistics
This is a flag that will determine whether or not CPU statistics are retrieved by the plugin. Disabling CPU statistics will improve performance of the plugin, but the following fields will not be displayed: totalCpuUsed, cpuPercentElapsed, cpuTimeElapsed.
Log Reader view
Note: Beginning Geneos 5.3.0, the Log Reader is available to send the contents of IFS log files into a stream.
This view shows the status of IFS log files and the associated outbound streams coming from the Log Reader plugin:
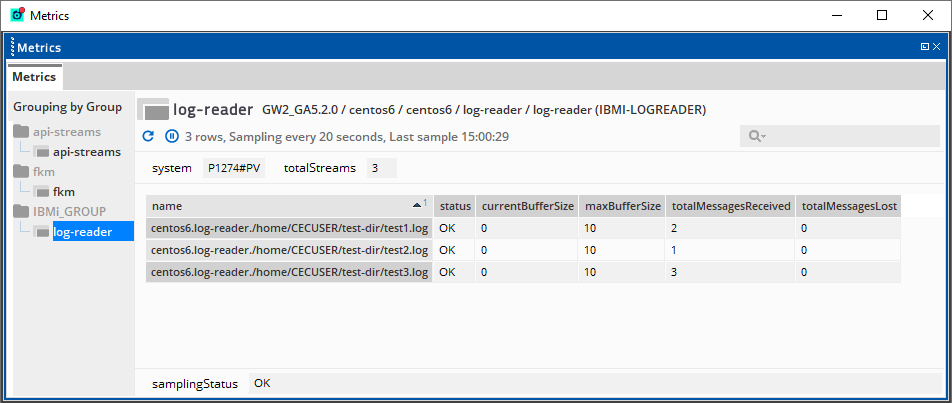
You can configure Log Reader sampler to read log files from the IFS, then send the contents of the log files as a stream for consumption by other plugins, such as the FKM and State Tracker plugins.
Headline legend
| Headline name | Description |
|---|---|
| system | Name of the system that the sampler is connected to. |
| totalStreams | Number of streams that have been created on the sampler. |
Table legend
| Headline name | Description |
|---|---|
| name |
Name of the stream. Log Reader outbound streams have a fully qualified stream name in the following format:
|
| status |
Status of the file stream. Possible values:
|
| currentBufferSize | Number of messages that the sampler holds in the stream. The sampler holds these messages until they are consumed by another sampler. |
| maxBufferSize | Maximum number of messages per stream that the sampler can hold before it starts to drop earlier messages. This field is set by the Buffer size configuration. For more information, see Log Reader configuration. |
| totalMessagesReceived | Total number of messages that the samplers has received in the stream. Every line in the log file counts as a message. |
| totalMessagesLost | Total number of messages that the sampler has dropped because the buffer was full. |
Note: Stream messages are stored in the buffer until they are consumed by another component. However, If there are no samplers or clients consuming the stream, then the stream registry purges the messages immediately.
Log Reader configuration
Basic configuration
| Option | Description |
|---|---|
| Filename |
Name of the log file to read in the host. This configuration supports wildcard expressions for filenames. Supported wildcard characters are Only one file will be associated with a wildcard pattern and stream at a time. The newest or most recently updated file matching the wildcard character will be monitored. |
| Rewind |
If ticked, the Log Reader reads from the beginning of a log file. Otherwise, the Log Reader reads from the last read position when the Netprobe or sampler is restarted. If both rewind and file position support are disabled, then the Log Reader reads from the end of the file. This option is disabled by default. |
|
|
Advanced configuration
| Option | Description |
|---|---|
| Buffer size |
Sets the maximum number of messages per stream that the Log Reader sampler holds in memory at a time. Messages clear the buffer when the stream is received by an FKMsampler. You can toggle between entering a numerical value ( Default value: |
| Worker pool size |
Number of worker tasks that can be executed for reading files concurrently. This enables the Log Reader sampler to read multiple files at the same time during a sampling. Files are queued and picked up for processing by an available worker. After being read, the files return to the queue for the next sample. You can tune the worker pool size so that the sampling of large or rapidly growing files would not block the sampling of other files. You can toggle between entering a numerical value ( Default value: |
Log Reader position file
By default, the Log Reader reads from the last read position of a log file when the Netprobe or sampler is restarted. It does this by maintaining position files, located in a directory called /ibmi-log-position directory under the Netprobe working directory. Position files are managed as follows:
- In the
/ibmi-log-positiondirectory has subdirectories for each Log Reader sampler. The directory name format is<ME-name>.<sampler-name>. - There is one position file per file being monitored, and updates immediately after each stream message is sent.
- A position file is removed when it has not been updated for a specified number of days. For more information, see Advanced configuration — File position support.
Position files enable you to stop and restart the Netprobe and have it pick up where it left off without missing any new lines added to the log.
Caution: If rewind is enabled, then the Log Reader plugin will always read the monitored file from the beginning.
Advanced configuration — File position support
| Option | Description |
|---|---|
| Enabled |
If ticked, then the Log Reader plugin keeps track of the current position of each monitored file. This makes it possible to resume from the last read position when the Netprobe is stopped or restarted. If both rewind and file position support are disabled, then the Log Reader reads from the end of the file. This option is ticked by default. |
| Remove after inactive for (days) |
Number of days that a position file is allowed to be inactive before it is deleted. Default value: |
Message view
This view shows messages for a specific message queue. It can be used to monitor and alert on messages in an message queue.
Messages are sorted from newest to oldest.

Headline legend
| Name | Description |
|---|---|
| system | The system name. |
| queuePath | The path of the message queue. For example, /QYS.LIB/QSYSOPR.MSGQ, where QSYSOPR is the name of the message queue. |
| totalMessages | The number of messages in the queue. |
| messagesMatchingFilter | The number of messages matching the filter |
| messageMaxRows | The number of rows that is set in the max rows setting. |
Table legend
| Name | Description |
|---|---|
| key | This field is a combination of the message key (the integer representation of the 4-byte message key) and the date the message was sent (YYYY-MM-DD). |
| id | The message ID. |
| severity | The message severity, which is a value between 0 and 99, or -1 if it is not set. |
| type |
The message type. Possible message types are:
|
| date | The date the message was sent (YYYY-MM-DD). |
| time | The time the message was sent. |
| senderJobName | The sender job name. |
| senderJobUser | The sender job's user. |
| senderJobNumber | The sender job number. |
| text | The text of the message with the substitution text inserted. |
Message Configuration
Caution: When you update the configuration of certain Java-based plug-ins, including this one, the Netprobe running it has to restart. Be aware of other potentially unrelated plug-ins that can be affected when you configure this particular plug-in.
Note: All filters in this plug-in use Java Regular Expressions.
queuePath
This is the message queue to monitor for the sampler. For example, /QSYS.LIB/QSYSOPR.MSGQ.
Mandatory: Yes
filters > severity
The message severity filter filters the messages to be displayed based on the message's severity. For example, if 50 is entered in this field, only messages with a severity of 50 and above will be shown.
Note: A message severity of -1 on a message means that the severity has not been set for that message.
filters > senderJobUser
This will filter the dataview to include only messages from the sender job user.
Note: This filter works by an exact match but is not case-sensitive.
filters > senderJobName
This will filter the dataview to include only messages from the sender job name.
Note: This filter works by an exact match but is not case-sensitive.
Pool view
This view shows the 's storage pools. Storage pools segment the working memory so that each subsystem can access its own specified piece of memory.

Headline legend
| Name | Description |
|---|---|
| system | The system name. |
| partitionId | The identifier for the partition. |
| pools | The number of storage pools. |
| totalAuxiliaryStorage | Total auxiliary storage for the partition. |
| systemASP | Storage capacity of the system auxiliary storage pool (ASP1), in MB. |
| percentageSystemASPUsed | The percentage of the system storage pool currently in use. |
Table legend
| Name | Description |
|---|---|
| id | The system pool identifier. |
| name | The storage pool name, e.g. *INTERACT. |
| size | The amount of main storage, in KB, currently allocated to the pool. |
| reservedSize | The amount of storage, in KB, in the pool reserved for system use. |
| databasePages | The rate, in pages per second, at which database pages are brought into the storage pool. |
| databaseFaults | The rate, in page faults per second, of database page faults against pages containing either database data or access paths. |
| nonDatabasePages | The rate, in pages per second, at which non-database pages are brought into the storage pool. |
| nonDatabaseFaults | The rate, in page faults per second, of non-database faults against pages other than those designated as database pages. |
Queue view
This view is used to monitor specific message queues on the . A message queue is like a mail box for messages - which is a communication sent from one user, program, or procedure to another. The has several message queues that hold messages that provide helpful information when finding and reporting problems. For example:
- QSYSOPR - the system operator message queue. This queue contains messages that require a reply from the operator.
- QSYSMSG - an optional message queue that holds severe error messages.
- QHST - the history log contains messages that track the system's activities.
The also provides message queues for the following:
- Each workstation on the system
- Each user enrolled on the system

Headline legend
| Name | Description |
|---|---|
| system | The system name. |
| totalQueues | The total number of message queues in the system. |
Table legend
| Name | Description |
|---|---|
| name | The name of the message queue. |
| path | The fully qualified integrated file system path name of the message queue. |
| totalMessages | The total number of messages in the queue. |
|
severityCodeFilter |
This is the severity code used by the message queue to filter messages. For example, for an interactive job, the messages are displayed at the display station if the severity code is high enough. By default, message queues have a severity code filter of zero (0). The value in this column will be between 0 and 99. Caution: Beginning Geneos 5.7.x, this column will be deprecated. |
Queue configuration
Note: All filters in this plug-in use Java Regular Expressions.
filters > queueNameFilter
Caution: Beginning Geneos 5.7.x, this setting will be deprecated and will be replaced with new filters for Queue library and Queue name. For more information, see Queue Advanced Configuration.
This will filter the dataview to include only queues with names matching this configuration.
Mandatory: No
Subsystem view
subsystems are an operating environment, defined by a subsystem description, where the system coordinates processing and resources. They are used to control how different jobs run on your system and how much resources are allocated to different jobs. This view shows configured subsystems of an system.
SECOFR required
Note: User type SECOFR is required to show data for all subsystems. If a non-SECOFR is used, only subsystems that the user has authority on will be shown with data. In such cases, the status will state "User is not authorised to subsystem."

Headline legend
| Name | Description |
|---|---|
| system | The system name. |
| subsystems | The total number of subsystems in the system. |
Table legend
| Name | Description |
|---|---|
| key | Library/name of subsystem. For example, QSYS/QSPL. |
| name | The name of the subsystem. |
| library | The name of the library where the subsystem resides. |
| activeJobs | The number of active jobs in the subsystem. |
| maxActiveJobs | The maximum number of possible jobs for the subsystem. NO_MAX means no maximum has been set. |
| pools | The number of storage pools defined for the subsystem. |
| status |
The status of the subsystem. Possible values are:
If the user that is utilised by the Netprobe does not have sufficient administrative rights for the subsystem, then 'User is not authorised to subsystem' will be shown in this column. |