If you are currently using version 5.x.x, we advise you to upgrade to the latest version before the EOL date. You can find the latest documentation here.
Kafka Monitoring User Guide
Overview
Kafka monitoring is a Gateway configuration file that enables monitoring of Kafka Brokers through a set of samplers with customised JMX plug-in settings.
Kafka is a distributed streaming platform that allows you to:
- Publish and subscribe to stream of records.
- Store streams of records in a fault-tolerant way.
- Process streams of records as they occur.
It is important to monitor Kafka because it carries crucial data that many applications rely on. Geneos provides a JMX server sampler configuration to monitor Kafka.
This guide discusses the steps to set up the Kafka integration on a Gateway. Once the integration is set up, the samplers providing the dataviews become available to that Gateway.
To view the sample metrics and dataviews, see Kafka Monitoring Technical Reference.
Intended audience
This guide is intended for users who are setting up, configuring, troubleshooting and maintaining this integration. Once the integration is set up, the samplers providing the dataviews become available to that Gateway.
As a user, you should be familiar with or any other database, and with the administration of the Kafka services.
Prerequisites
The following requirements must be met prior to the installation and setup of the template:
- A machine running the Netprobe must have access to the host where the Kafka instance is installed and the port Kafka is listening to.
- A JMX-enabled Kafka cluster.
- Netprobe 4.6 or higher.
- Gateway 4.8 or higher.
- Kafka 1.0.0.
Java requirements
- You must have Java installed on the machine running the Netprobe. For information on supported Java versions, see Java support in 5.x Compatibility Matrix.
- Once you have Java installed, configure the environment variables required by the Netprobe so that it can locate the required resource files. For guidance, see Configure the Java environment.
Caution: The Java installation and environment configuration is a common source of errors for users setting up Java-based components and plug-ins. It is recommended to read Configure the Java environment to help you understand your Java installation.
Installation procedure
Ensure that you have read and can follow the system requirements prior to installation and setup of this integration template.
- Download the integration package
geneos-integration-kafka-<version>.zipfrom the ITRS Downloads site. - Open Gateway Setup Editor.
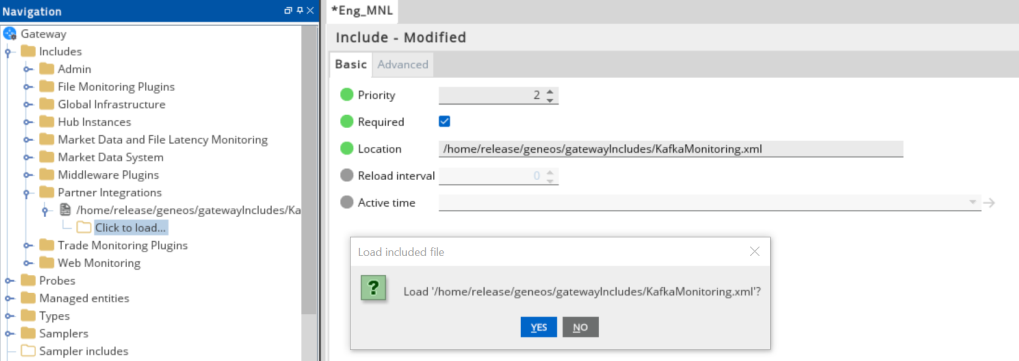
- In the Navigation panel, click Includes to create a new file.
- Enter the location of the file to include in the Location field. In this example, it is the
include/KafkaMonitoring.xml. - Update the Priority field. This can be any value except
1. If you input a priority of1, the Gateway Setup Editor returns an error. - Expand the file location in the Include section.
- Select Click to load.
- Click Yes to load the new Kafka include file.
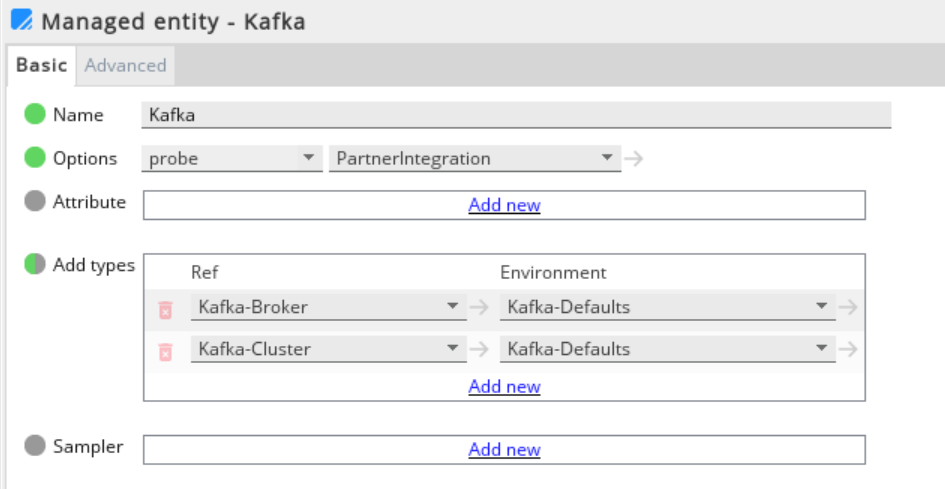
- Click Managed entities in the Navigation panel.
- Add the Kafka-Broker and Kafka-Cluster types to the Managed Entity section that you will use to monitor Kafka.
- Click Validate current document
 to check your configuration.
 - Click Save current document
 to apply the changes.
Set up the samplers
These are the pre-configured samplers available to use in KafkaMonitoring.xml.
Configure the required fields by referring to the table below:
| Samplers |
|---|
| Kafka-HeapMemoryUsage |
| Kafka-Broker |
| Kafka-Topics |
| Kafka-Cluster |
Set up the variables
The KafkaMonitoring.xml template provides the variables that are set in the Environments section:
| Variable | Description |
|---|---|
| KAFKA_MONITORING_GROUP_NAME | Sampler group name. |
| KAFKA_JMX_HOST | Host name (or IP address) of the machine hosting the broker. |
| KAFKA_JMX_PORT | JMX port that has been configured for that broker. |
Set up the rules
The KafkaMonitoring-SampleRules.xml template also provides a separate sample rules that you can use to configure the Gateway Setup Editor.
Your configuration rules must be set in the Includes section. In the Navigation panel, click Rules.
The table below shows the included rules in the integration file:
| Sample Rules | Description |
|---|---|
| Broker - Kafka Status |
Generates a human readable version of the numeric State value of the broker and has the following conditions:
|
| Cluster - Partition Underreplicated | Applies to all cells in a Kafka-Cluster. The rule turns red if the value is > 0. |
| Broker - Active Controller | Applies to all Active Controller Count Cells in the Kafka-Broker. The Active Controller count shows the number of active controllers across the cluster. A value of greater than 1 in this column indicates that there are more than one controllers with alerts. |
| Broker - Offline Partitions | Applies to all offline partitions count in the Kafka-Broker. The offline partitions count shows the total number of under replicated partitions across the cluster. A value of greater than 0 indicates that there are under replicated partitions with alerts. |