If you are currently using version 5.x.x, we advise you to upgrade to the latest version before the EOL date. You can find the latest documentation here.
ITRS Synthetic Monitoring User Guide
Overview
ITRS Synthetic Monitoring (powered by Apica) allows you to monitor websites, web applications, and web services. The integration with Geneos enables you to retrieve all the checks and alert statistics configured in the Apica dashboard and display them as dataviews in Geneos.
The ITRS Synthetic Monitoring integration provides a Gateway configuration file that enables monitoring of the Apica environment through a set of pre-configured Toolkit samplers. The script can be configured by a set of environment variables and command line options.
This guide walks you through the integration process.
Audience
This user guide is intended for users who will be setting up, configuring, troubleshooting and maintaining this integration.
You should be familiar with Python and with general administration of the Apica environment.
Prerequisites
The following requirements must be met prior to the installation and setup of the template:
- Python 2.7 or newer, or Python 3.6 or newer
- pip module
- Python Requests module
Installation procedure
The Synthetic Monitoring integration is largely pre-configured and involves three primary steps:
- Download the integration files from the resources site.
- Load the integration file in the Gateway Setup Editor.
- Associate the samplers with a managed entity.
Note: The include files are intended to be read-only and should not be edited (unless the integration specifically requires for them to be modified). This is because include files can be shared between a few instances of a Gateway and best practice is to share them in their default state. It is also to make the upgrades and maintenance process of the integration files easier. All configuration should be carried out in your local Gateway files instead.
Download the integration files
- Download the integration package
geneos-integration-apica-<version>.zipfrom the ITRS Downloads site. - As a best practice, save the files on the same machine where your Gateway is running.
The integration package includes a number of files. These are the files that determine the integration setup:
include/apicaMonitoring.xml— Gateway configuration file (also called an include file) containing Toolkit samplers configured for Synthetic Monitoring.scripts/Get_Apica_Checks.py— Python script that calls Apica API and returns a JSON format. The JSON values are then processed in a CSV format and displayed in Active Console.
Load the integration files
To load the integration files into the Gateway Setup Editor, follow these steps:
- Open Gateway Setup Editor.
- In the Navigation panel, click Includes to create a new file.
- Enter the location of the file to include in the Location field. In this example, it is the
include/apicaMonitoring.xml. - Update the Priority field.
- Expand the file location in the Include section.
- Select Click to load.
- Click Yes to load the new include file.
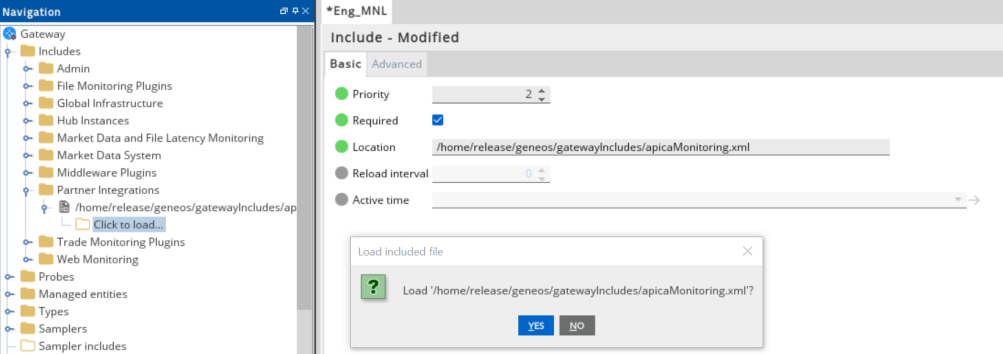
Gateway configuration now appears in the Includes section.
For more information on the dataviews associated with the Synthetic Monitoring integration, see the ITRS Synthetic monitoring Technical Reference.
Associate the samplers with a managed entity
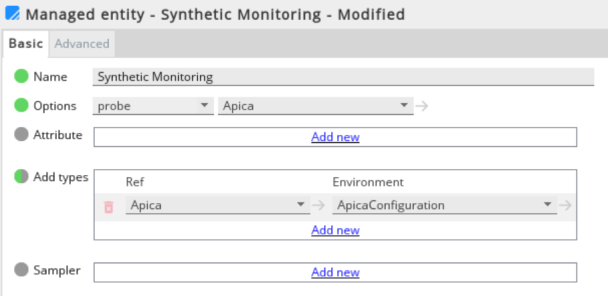
After you have loaded the configuration file, the Synthetic Monitoring monitoring samplers become available for use. These samplers are associated with a pre-defined Type. To associate the samplers with a managed entity, follow these steps:
- In the Gateway Setup Editor, create a new managed entity by right-clicking the Managed entities folder.
- Under the Basic tab for the new managed entity, add a pre-configured
Apicatype. - Specify the environment associated with the samplers. By default, this is
ApicaConfiguration. - Apply the managed entity to the running Netprobe.
- Click Validate current document
 to check your configuration.
 - Click Save current document
 to apply the changes.
After you save your changes to the managed entity, the Apica dataviews appear under the managed entity on the state tree.
For more information about include files, see the Gateway Setup Editor.
Environment configuration
The default environment configuration is created by the apicaMonitoring.xml script. You can create a new environment or modify the default ApicaConfiguration environment variables according to your system.
Note: Standard variable scoping rules apply when variable reference is used in include files. Please take note of that when creating your own variables. For more information, see Variable Scoping and Resolution in User Variables and Environments.
For more information on the environment variables and command line options used in this integration, see the ITRS Synthetic monitoring Technical Reference.
Knowledge base
Knowledge base links are configured to redirect users to the detail view of the selected metric in the Apica dashboard. The links are created by concatenating the dashboard link which is configured as a URL template and the row name value (which is the Check ID). You can edit the links or change the labels where required. For more information on managing knowledge base article links, see Knowledge base in Gateway Advanced Features.
Further reading
After you have included the monitoring samplers, you can learn about its dataviews and environment configuration in the ITRS Synthetic monitoring Technical Reference.