If you are currently using version 5.x.x, we advise you to upgrade to the latest version before the EOL date. You can find the latest documentation here.
Elasticsearch Monitoring User Guide
Overview
Elasticsearch monitoring is a Gateway configuration file that enables monitoring of Elasticsearch Cluster through the Toolkit plug-in.
Elasticsearch is a distributed, search, and analytics engine that is capable of scaling horizontally, allowing to add more nodes to the cluster. This means that it can search and analyze large scale of data.
The elements that make Elasticsearch work are defined as follows:
- Node is a running instance of Elasticsearch that is capable of knowing the location of the document.
- Cluster consists of one or more nodes with the same cluster name that can share their data and load.
Track the following key areas when using Elasticsearch monitoring:
| Key Area | Description |
|---|---|
| Search performance | Determine how the search function perform over time by monitoring the query operations, load or latency, field data cache and evictions. |
| Indexing performance | Each shard in the index can be updated through flush and refresh process.
Shard is a container for data that can be either a primary or a replica shard. It is how the Elasticsearch distributes data in the clusters.
|
| Cluster health and node availability | Monitors the current state of all clusters and nodes. |
| Resource utilisation | Provides information on how the thread pool queues and rejection works in monitoring the bulk, index, merge, and operations. |
| System and network metrics | Shows information about every node in the cluster, resource and memory usage, and active connections opened over time. |
In this Elasticsearch monitoring template, you will see these metrics in your dataview:
- Cluster health
- Indexing performance
- Search performance
- Node and resource information
- Thread pool
To view the sample metrics and dataviews, see Elasticsearch Monitoring Technical Reference.
Intended audience
This guide is intended for users who are setting up, configuring, troubleshooting and maintaining this integration. Once the integration is set up, the samplers providing the dataviews become available to that Gateway.
As a user, you should be familiar with or any other database, and with the administration of the Elasticsearch services.
Prerequisites
The following requirements must be met prior to the installation and setup of the template:
- A machine running the Netprobe must have access to the host where the Elasticsearch instance is installed and the port Elasticsearch is listening to.
- Netprobe 4.6 or higher.
- Gateway 4.8 or higher.
- Python 2.7 or 3.6 installation on the machine where the Netprobe resides.
- Elasticsearch 6.1.2.
Installation procedure
Ensure that you have read and can follow the system requirements prior to installation and setup of this integration template.
- Download the integration package
geneos-integration-elasticsearch-<version>.zipfrom the ITRS Downloads site. - Open Gateway Setup Editor.
- In the Navigation panel, click Includes to create a new file.
- Enter the location of the file to include in the Location field. In this example, it is the
include/ElasticsearchMonitoring.xml. - Update the Priority field. This can be any value except
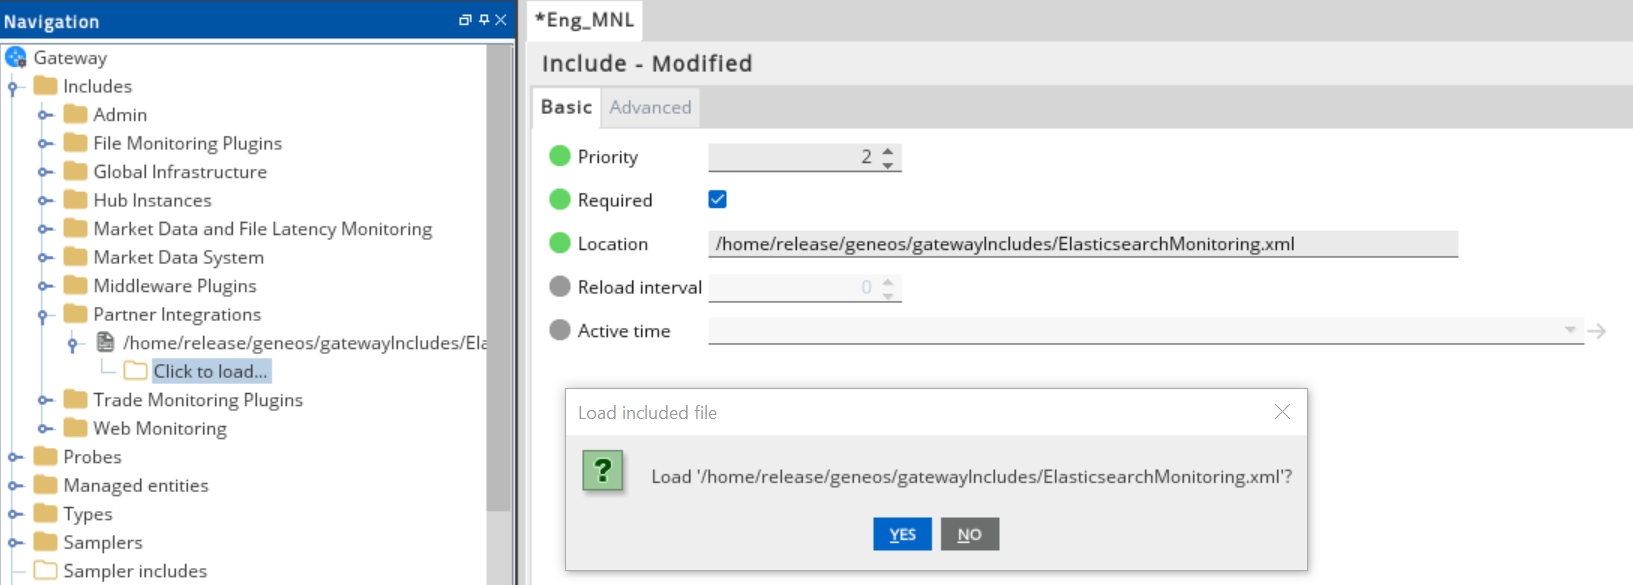
1. If you input a priority of1, the Gateway Setup Editor returns an error. - Expand the file location in the Include section.
- Select Click to load.
- Click Yes to load the new Elasticsearch include file.
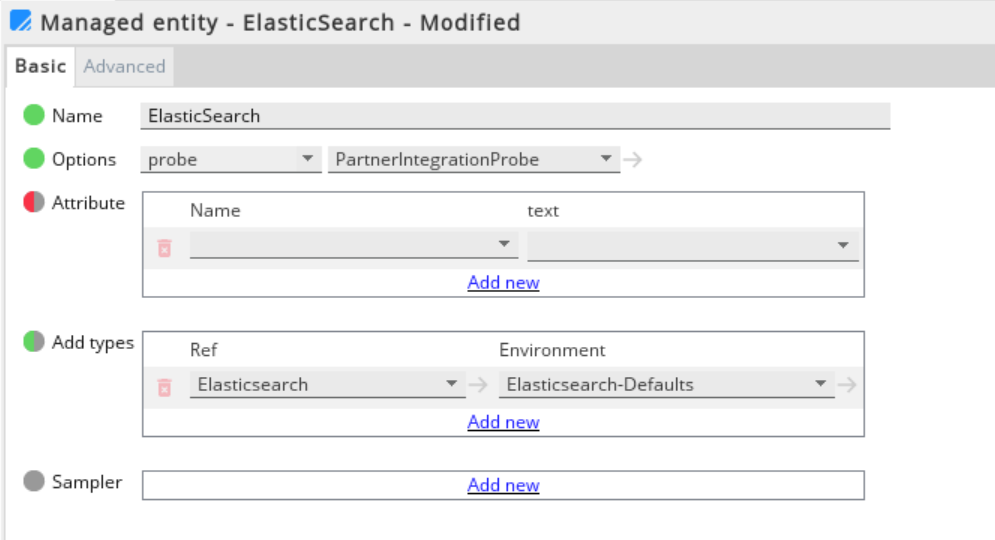
- Click Managed entities in the Navigation panel.
- Add the Elasticsearch type to the Managed Entity section that you will use to monitor Elasticsearch.
- Click Validate current document
 to check your configuration.
 - Click Save current document
 to apply the changes.
Set up the samplers
These are the pre-configured samplers available to use in include/ElasticsearchMonitoring.xml.
Configure the required fields by referring to the table below:
| Samplers |
|---|
| Elasticsearch-ClusterHealth |
| Elasticsearch-ThreadPool |
| Elasticsearch-Resource |
| Elasticsearch-NodeInfo |
| Elasticsearch-SearchPerf-ByIndex |
| Elasticsearch-SearchPerf-ByNode |
| Elasticsearch-IndexingPerf-ByIndex |
| Elasticsearch-IndexingPerf-ByNode |
Set up the variables
The include/ElasticsearchMonitoring.xml template provides the following variables that are set in the Environments section:
| Variable | Description |
|---|---|
| ELASTICSEARCHMON_GROUP | Sampler group name. Default: Elasticsearch-Monitoring |
| ELASTICSEARCHMON_HOST | IP/Hostname of the Elasticsearch Node. Default: localhost |
| ELASTICSEARCHMON_PORT | Port assigned to the Elasticsearch HTTP service . Default: 9200 |
| ELASTICSEARCHMON_PYTHON_EXE | Name of the executable script that calls the python code. |
Set up the rules
The ElasticsearchMonitoring-SampleRules.xml template also provides a separate sample rules that you can use to configure the Gateway Setup Editor.
Your configuration rules must be set in the Includes section. In the Navigation panel, click Rules.
The table below shows the included rule setup in the configuration file:
| Rules | Sample Rules |
|---|---|
| Resource | Elasticsearch-Diskspace |
| Elasticsearch-FileDesc | |
| Elasticsearch-Cpu | |
| ClusterHealth | Elasticsearch-ClusterStatus |
| Indexing | Elasticsearch-IndexingLatency |
| Elasticsearch-RefreshLatency | |
| Elasticsearch-FlushLatency | |
| Search | Elasticsearch-QueryLatency |
| Elasticsearch-FetchLatency | |