If you are currently using version 5.x.x, we advise you to upgrade to the latest version before the EOL date. You can find the latest documentation here.
MongoDB
Overview
MongoDB monitoring is a Gateway configuration file that enables monitoring of MongoDB through the Toolkit plug-in.
MongoDB can monitor the database environment in a measurable way to spot any potential discrepancies and issues.
Some key areas to track when using MongoDB monitoring:
| Key Area | Description |
|---|---|
| Metrics | Determine the crucial alerts to be set in the metrics to avoid any performance issues or errors. |
| Database performance | Monitor the database's current state. |
| Resource utilisation | Monitor the number of client connections to avoid abnormal traffic loads that can lead to performance issues. |
| Asserts | Show errors raised during the selected time period. |
MongoDB helps you to get an overview of database operations, such as:
- Track the current state of database.
- View reports of asserts on the database.
- Monitor the metrics for write performance.
- View contains storage statistics for a given database.
- Check reports information regarding the state and use of indexes in MongoDB.
Intended audience
This guide is intended for users who are setting up, configuring, troubleshooting and maintaining this integration. This is also intended for users who will be using Active Console to monitor data from MongoDB. Once the integration is set up, the samplers providing the dataviews become available to that Gateway.
As a user, you should be familiar with MySQL or any other database, and with the administration of the MongoDB servers.
Prerequisites
The following requirements must be met before the installation and setup of the template:
- A machine running the Netprobe must have access to the host where the MongoDB instance is installed and the port MongoDB is listening to.
- Netprobe version 4.6 or higher.
- Gateway version 4.8 or higher.
- MongoDB version 3.6.
Installation procedure
Ensure that you have read and can follow the system requirements prior to installation and setup of this integration template.
- Download the integration package
geneos-integration-mongoDB-<version>.zipfrom the ITRS Downloads site. - Open Gateway Setup Editor.
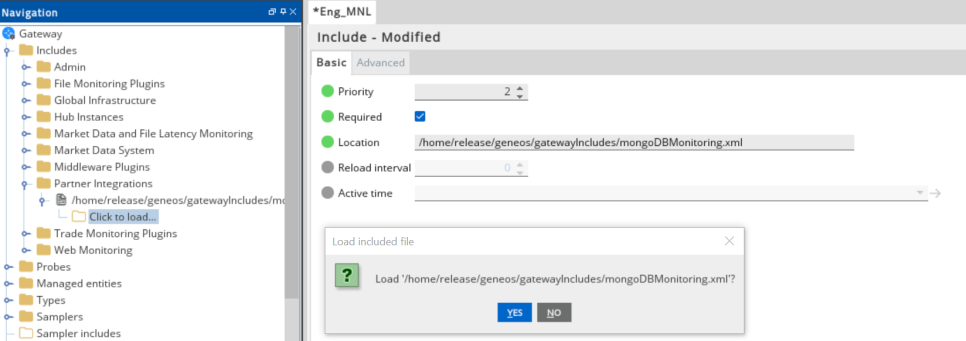
- In the Navigation panel, click Includes to create a new file.
- Enter the location of the file to include in the Location field. In this example, it is the
include/MongoDBMonitoring.xml. - Update the Priority field. This can be any value except
1. If you input a priority of1, the Gateway Setup Editor returns an error. - Expand the file location in the Include section.
- Select Click to load.
- Click Yes to load the new MongoDB include file.
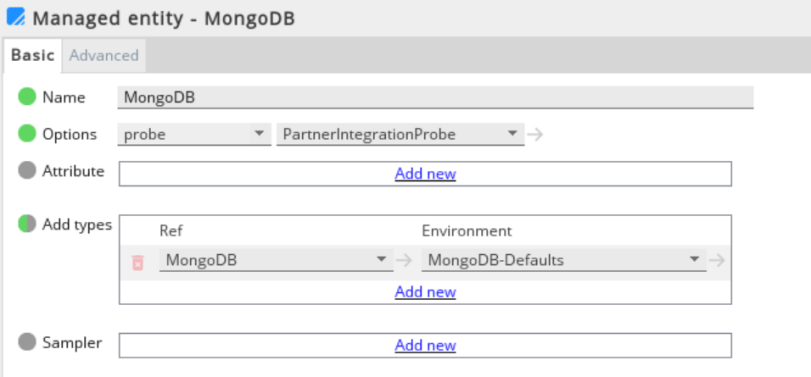
- Click Managed entities in the Navigation panel.
- Add the MongoDB type to the Managed Entity section that you will use to monitor MongoDB.
- Click Validate current document
 to check your configuration.
 - Click Save current document
 to apply the changes.
Set up the samplers
These are the pre-configured samplers available to use in MongoDBMonitoring.xml.
Configure the required fields by referring to the table below:
| Samplers |
|---|
| MongoDB-dbStats |
| MongoDB-Locks |
| MongoDB-Memory |
| MongoDB-BackgroundFlushing |
| MongoDB-Opcounters |
| MongoDB-Asserts |
| MongoDB-Instance |
| MongoDB-Cursors |
| MongoDB-ConcurrentTransactions |
| MongoDB-Replication |
Set up the variables
The MongoDBMonitoring.xml template provides the following variables that are set in the Environments section:
| Variables | Description |
|---|---|
| MONGODB_SAMPLE_INTERVAL | Sample interval used by all the Mongo samplers. |
| MONGODB_CLIENT | Full path of the Mongo client. The toolkit script uses this to communicate with the MongoDB instance. |
| MONGODB_GROUP | Group name used by all the Mongo Samplers. |
| MONGODB_CONNECTION |
Follow the format <host>:<port>
|
| MONGODB_SCRIPT_DIR | Directory where the sampler scripts will be generated. |
| MONGODB_DB | Specifies the name of the database to connect to. |
Note: The default values can be changed by providing an environment named Mongo with a higher priority in the set-up file, or by using an environment in the Managed entity where the type is defined.
Set up the rules
The MongoDBMonitoring-SampleRules.xml template also provides a separate sample rules that can be used to configure the Gateway Setup Editor.
Your configuration rules must be set in the Includes section. In the Navigation panel, click Rules
The table below shows the included rules in the integration file.
| Sample Rules |
|---|
| MongoDB-Asserts |
| MongoDB-CursorsWithTimeout |
| MongoDB-TicketAvailability |
| MongoDB-ReplicaState |
| MongoDB-ReplicationLag |
Metrics and dataviews
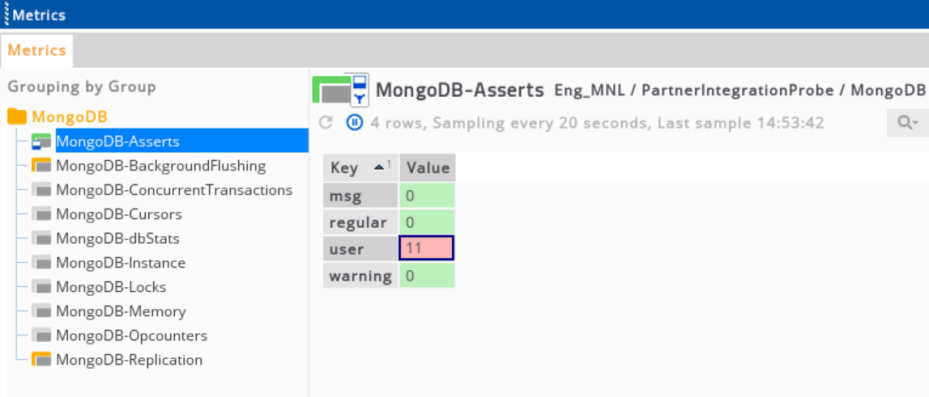
MongoDB asserts
This view reports the number of asserts on the database:
| Column Name | Description |
|---|---|
| msg | Number of message assertions raised since the server process started. |
| regular | Number of regular assertions raised since the server process started. |
| user | Number of user-asserts that have occurred since the last time the server process started. |
| warning | Number of warnings raised since the server process started. |
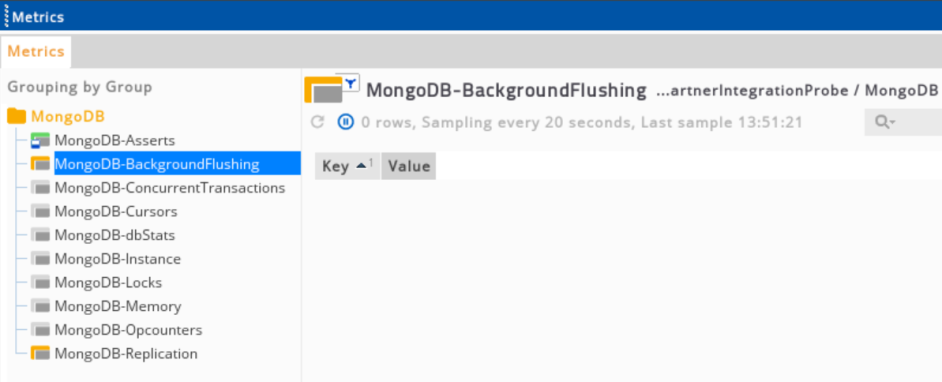
MongoDB background flushing
The information on this view appears only for instances that use the MMAPv1 storage engine. Mongod periodically flushes and writes to disk.
In the default configuration, this happens every 60 seconds. This view contains data regarding these operations.
These metrics are important for write performance and journaling.
MongoDB concurrent transactions
The information on this view appears only for instances that use the wiredTiger storage engine.
This contains ticket details that the wiredTiger uses for its thread management.
![]()
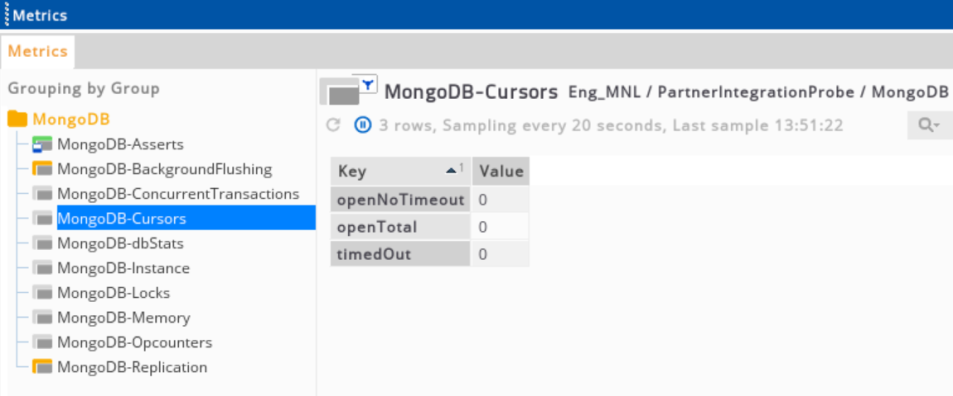
MongoDB cursors
This view contains data regarding cursor state and use:
| Column Name | Description |
|---|---|
| openNoTimeout | Number of open cursors with timeout disabled. |
| openTotal | Number of cursors that MongoDB is maintaining for clients. Since MongoDB exhausts unused cursors, this value is usually small or zero. |
| timedOut | Provides a counter of the total number of cursors that have timed out since the server process started. If this number is larger or growing at a regular rate, this may indicate an application error. |
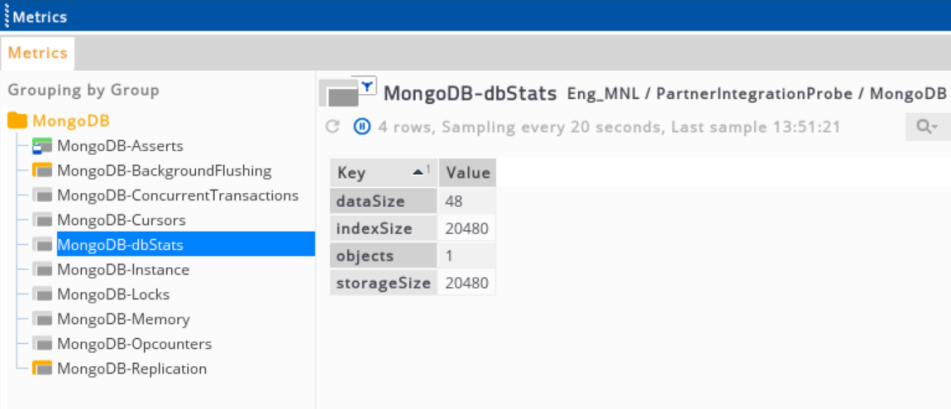
MongoDB dbStats
This view contains storage statistics for a given database. You can pass their database to the provided script:
| Column Name | Description |
|---|---|
| dataSize | Total size in bytes of the data held in this database including the padding factor. |
| indexSize | Total size in bytes of all indexes created on this database. |
| objects | Contains a count of the number of objects like documents in the database across all collections. |
| storageSize | Total amount of space in bytes allocated to the collections in this database for document storage. |
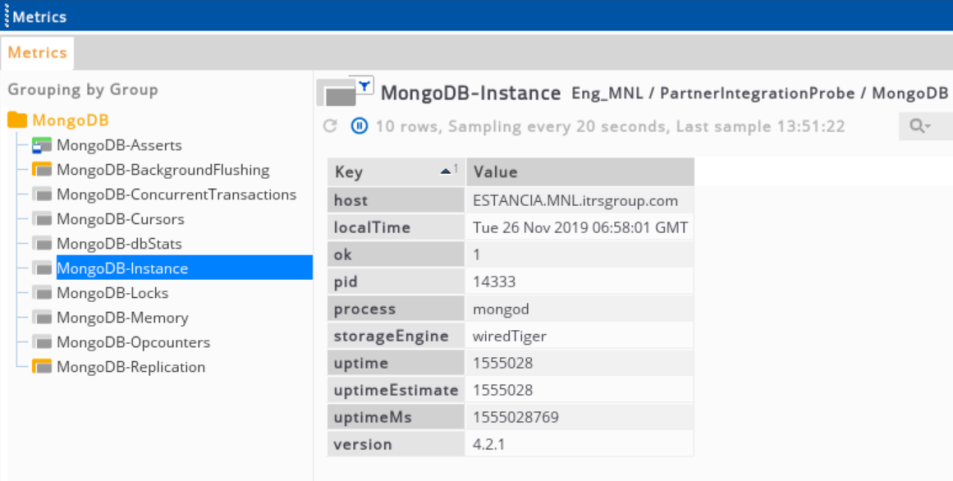
MongoDB instance
This view contains a build summary for the MongoDB server instance:
| Column Name | Description |
|---|---|
| host | Configured host in the system. |
| localTime | Current time based on the server. |
| ok | Status of the server instance. |
| pid | Process ID number. |
| process | Current MongoDB process: mongod or mongos. |
| storageEngine | Type of storage engine. |
| uptime | Number of seconds that the MongoDB process has been active. |
| uptimeEstimate | Number in seconds based from MongoDB’s internal time keeping system. |
| uptimeMs | Number of milliseconds that the MongoDB process has been active. |
| version | Version of the current MongoDB process. |
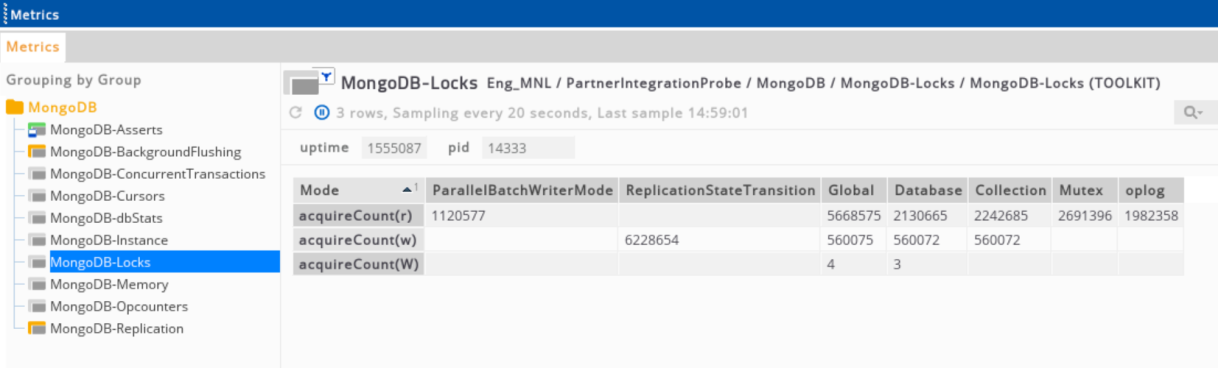
MongoDB locks
This view provides a granular report on MongoDB database-level lock use:
| Column Name | Description |
|---|---|
| acquireCount |
Number of times the lock has been acquired. Possible lock modes:
|
| acquireWaitCount |
Number of times when lock acquisitions waits because locks have encountered conflicts. Possible lock modes:
|
| timeAcquiringMicros |
Cumulative waiting time in microseconds for the lock acquisition. Possible lock modes:
|
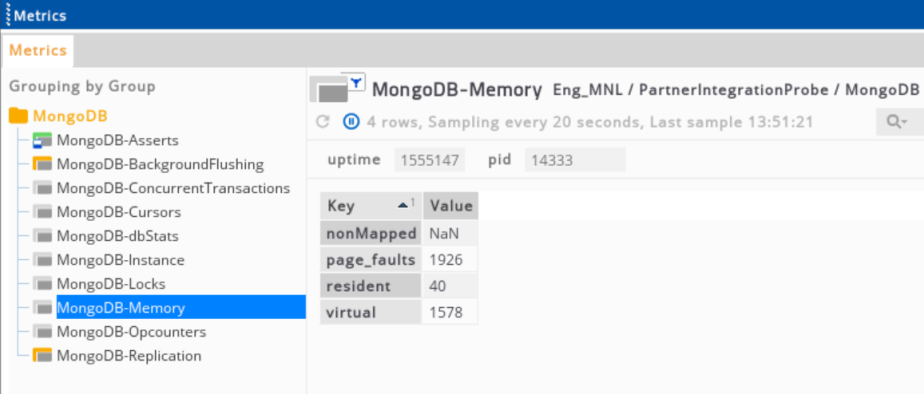
MongoDB memory
This view contains the MongoDB memory metrics:
| Column Name | Description |
|---|---|
| mapped | Provides the amount of mapped memory (in MB) by the database. Because MongoDB uses memory-mapped files, this value is likely to be roughly equivalent to the total size of your database(s). |
| nonMapped | Virtual memory collected by connections. |
| page_faults | Number of times MongoDB has requested to connect from disk per second. |
| resident | Equivalent to the amount of RAM (in MB) currently used by the database process. In normal use this value tends to grow, approaching total amount of system memory in dedicated servers. |
| virtual | Displays the quantity (in MB) of virtual memory used by the mongod process. If virtual value is significantly larger than mapped (e.g. 3 or more times), this may indicate a memory leak. |
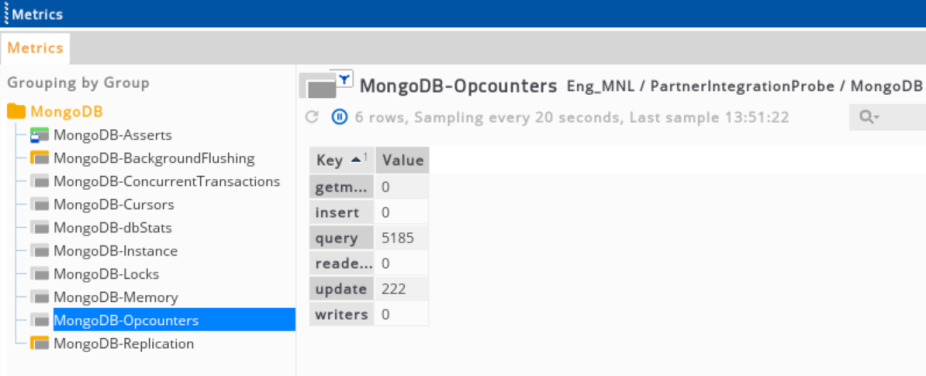
MongoDB opcounters
This view provides an overview of database operations by type. These numbers will grow over time and in response to database use:
| Column Name | Description |
|---|---|
| getmore | Provides a counter of the total number of "getmore" operations since the mongod instance last started. This counter can be high even if the query count is low. |
| insert | Total number of "insert" operations since the mongod instance last started. |
| query | Total number of queries since the mongod instance last started. |
| readers | Number of clients with read operations. |
| update | Total number of "update" operations since the mongod instance last started. |
| writers | Number of clients with write operations. |
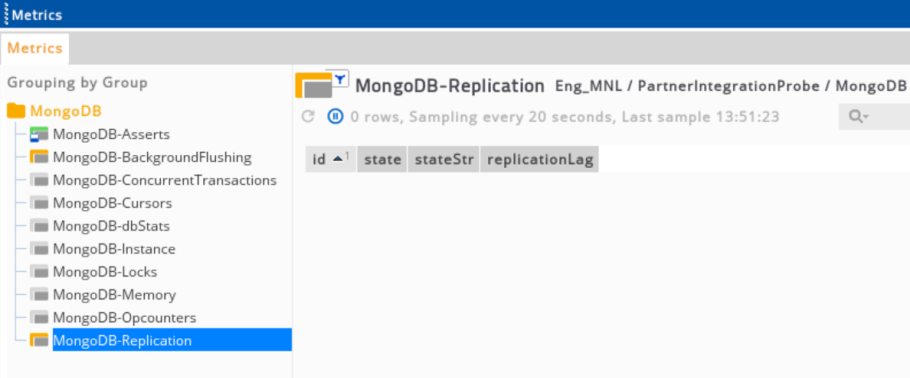
MongoDB replication
This information appears only if the replica set is used and it contains metrics related to replication:
| Column Name | Description |
|---|---|
| id | Unique identifier for each replication. |
| state | Value of state between 0 and 10 that represents the replica state. |
| stateStr | Describes the state string. |
| replicationLag | Shows the delay between a write operation on the primary and to its secondary. If the replication lag is set to zero, that means that there is no load issues yet. |