If you are currently using version 5.x.x, we advise you to upgrade to the latest version before the EOL date. You can find the latest documentation here.
Netprobe Memory Debugging
Overview
The Netprobe has memory protection variables that prevent it from consuming too much memory.
For example, the following Netprobe log entry is an indication that memory protection features have been triggered:
ERROR: NetProbe Restart Message: IMPORTANT - Contact your support provider; if supported directly by ITRS then mailto:support@itrsgroup.com (0) otherwise your usual support contact
The said features are triggered when the memory threshold is about to be breached. The threshold can be modified by changing the memory protection settings. For more information, see Netprobe Memory Protection Settings.
This topic walks you through the setup of memory debugging in the Netprobe.
Note: The memory discussed in this guide is the Netprobe virtual memory.
Caution: It is not recommended to interpret the Netprobe memory logs in isolation. This option is presented to aid in troubleshooting. For further assistance, contact ITRS Support.
Set up memory debugging
- In the Gateway Setup Editor, select the probe that you want to debug.
- In that probe, select the Debug tab.
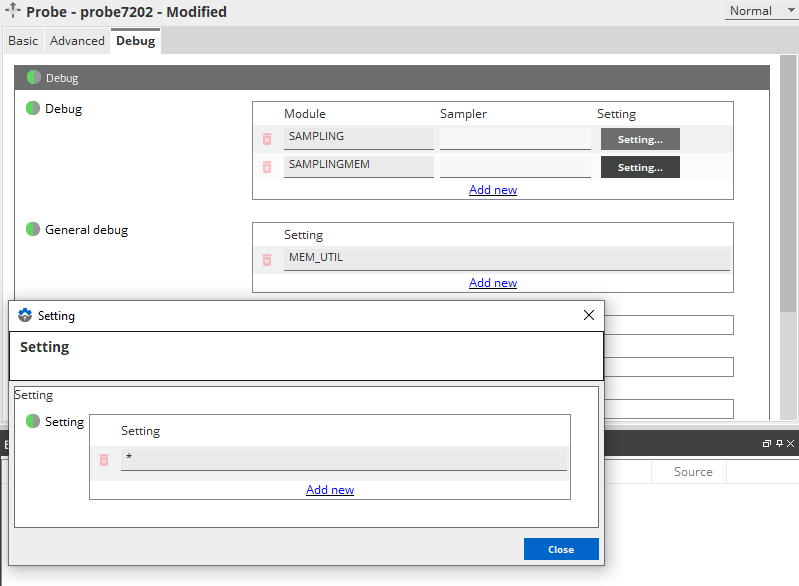
- Under the Debug field, click Add new to add the following two modules:
SAMPLINGSAMPLINGMEM
- For each module, click Setting. The Setting window appears.
- In the Setting window, add
*to the Setting field and click Close. - Under the General debug field, click Add new to add the
MEM_UTILmodule. - Click Save current document
 to apply your changes.

Success: The SAMPLING and SAMPLINGMEM modules begin to appear on the Netprobe log file. The MEM_UTIL module start writing to the log every ten minutes.
Indication of success
To know if memory debugging is running as set, check the Netprobe logs for the following:
<Thu Nov 07 00:25:15> DEBUG: SAMPLING:* IN : MQ-QINFO[M Queue Info]
<Thu Nov 07 00:25:15> DEBUG: SAMPLINGMEM:* IN : workingSet = 12066816 bytes, pagefileUse =16617472 bytes
<Thu Nov 07 00:25:15> DEBUG: SAMPLINGMEM:* OUT : workingSet = 12189696 bytes, pagefileUse = 16650240 bytes, memoryDifference = 122880 bytes, memoryDifferenceTotal =1200128 bytes
<Thu Nov 07 00:25:15> DEBUG: SAMPLING:* OUT : MQ-QINFO[MQ Queue Info] [0.000000 sec]
SAMPLING and SAMPLINGMEM logs come as a set of IN and OUT logs.
The MEM_UTIL logs write to the log every ten minutes:
<Wed Jul 24 07:29:19> INFO: MEM_UTIL INFO: Netprobe mem utilisation 1428196 KB from 510940 KB
<Wed Jul 24 07:39:22> INFO: MEM_UTIL INFO: Netprobe mem utilisation 1446628 KB from 510940 KB
<Wed Jul 24 07:49:28> INFO: MEM_UTIL INFO: Netprobe mem utilisation 1465044 KB from 510940 KB
<Wed Jul 24 07:59:33> INFO: MEM_UTIL INFO: Netprobe mem utilisation 1496724 KB from 510940 KB
Further reading
For more information on Netprobe memory protection, see Netprobe Memory Protection Settings.