If you are currently using version 5.x.x, we advise you to upgrade to the latest version before the EOL date. You can find the latest documentation here.
Event Tickers Dockable
Overview
The Event Tickers dockable contains a number of event ticker tabs. Each tab has a name and contains a list of local and Gateway events.
To open this dockable, go to Active Console > View > Event Tickers.
The EventTicker 0 tab is known as the Primary Event Ticker. It is the only event ticker that you can modify and has an icon in addition to its name.
It allows you to rename, attach, and detach the primary event ticker. However, by default, it is not possible to move this tab and switch its location from the other event ticker tabs.
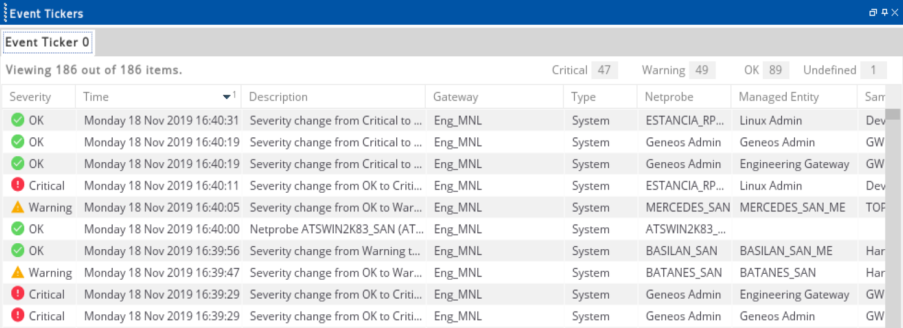
Each event ticker tab shows the relevant information of an event in different columns, such as the:
- Fully qualified path of the item for which the event is raised.
- Name of individual items that make up the fully qualified path. If the path does not contain the precise information about the items that make up the path, then the event ticker shows empty values for those events in the columns of those data items.
Moreover, if the event occurred for a managed entity, the fully qualified path contains Gateway followed by managed entity, and not contain any items below that managed entity, such as dataview, sampler or a cell.
Therefore, in such cases where it is not possible to get the name of items from the path of an event, the data item columns for that event contains empty values.
Another case where the data item column values of certain events could be empty is when the path contains some wild cards.
The following features are available in the event ticker when you right-click the Event Tickers dockable screen:
| Field | Description |
|---|---|
| Import |
Imports events through a data source query. The Import Dialog screen is prompted that allows you to specify the time span to consider, from where the historical events is imported, the maximum number of results to return and whether the query must be additionally constrained by considering the path of the component which raised the event or not. |
| Export | Exports the filtered contents of the event ticker to a comma separated (CSV) file. If no filters are applied, then all events are exported. |
| Pause Updates |
Determines whether new events that come from the connected Gateways must be displayed in the event ticker. Any events that you missed while the event ticker is paused are displayed when it is disabled. |
| Filters | Sets the filter that is applied to the event ticker |
| Clear Filters | Removes the filter that is applied to the event ticker. |
| Refresh | Refreshes the event ticker to get the latest data items from the Gateway. |
| Start/Stop | Begins or ends to display the list of local and Gateway events in the Event Tickers dockable. |
| Copy from event | Shows the list of event tickers filters. |
| Event commands | Displays the list of event commands in the Event Tickers dockable. |
The columns of an Event Ticker can be changed in the following ways:
- Set column size — allows you to enter the preferred column width in pixels. You can also apply this setting to all columns.
- Auto Resize This Column — automatically resize the selected column.
- Auto Resize All Columns — automatically resize all columns in the Event tickers dockable.
- Hide This Column — hides the selected column. To display it, right-click the column and select the hidden column name.
- Reset to Default — reverts the changes to the original settings.
- Select All the Cells — selects and highlights the all the rows.
- Clear Selection — removes the selection to all the rows.
- Re-ordered columns — moves the selected column by dragging it to the desired location.
- Change column width — you can manually change the width of a column by adjusting its column line based on your preferred width.
The column settings for a list view are persisted in the workspace and restored on load.
Import historical events from database
The Active Console is capable of retrieving events and chart data from a database. When retrieving from a database, the Active Console only connects to the database at the time of the query, and does not block user actions or remain connected to the database for the duration of the query.
Before you can import historical events from a database
into an existing or new event ticker, check that your Gateway set up has a running database entry. To check the database entry, go to Active Console Settings > Database or check if the running Gateway displays the Log to database on its icon in the Gateways dockable.
To view the other visual indicators, see .
To import historical events, follow these steps:
- Right-click the row in the Severity column.
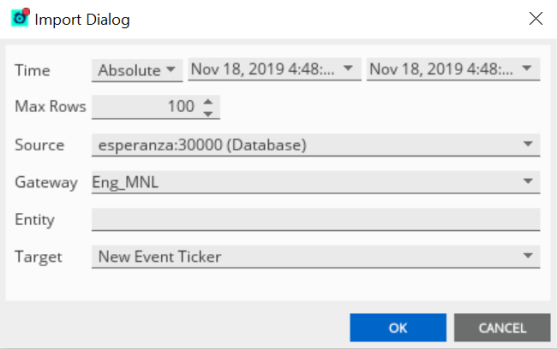
- Click Import. The Import Dialog appears on the screen.
- Select the time period on the Time menu.
- Select the source of data on the Source menu.
- If you have multiple Gateways, select the specific Gateway on the Gateway menu.
- Click OK.
| Field | Description |
|---|---|
| Time |
Selects the time period for the events you want to import :
|
| Max Rows | Maximum number of rows you want to receive. |
| Source | Indicates if the source is Database or Gateway Hub. |
| Gateway |
If the database contains events for several Gateways, you can limit the events that are returned by Gateway. If no Gateway is specified, then the import covers all Gateways in the database for the time period. This feature is essential if you have several Gateways logging to the same database. |
| Entity |
Limits the events by Managed Entity . It can be used on its own or in conjunction with the Gateway field, in which case the imported events matches the managed entity in the specified Gateway. |
| Target | Defines the target event ticker. |
Caution: Setting the maximum rows to a very large number (50,000+) may cause Active Consoleto become unstable, as it requires a large amount of memory.
When you click OK, an asynchronous data source query is dispatched to the database that allows you to continuously use the Active Console. Once the database is returned, the results of the events appear in your nominated event ticker.
Events created in this manner are retained when the workspace is saved and restored.
Note: If there is a relative time filter set on the event ticker, then the events that are older than the specified time must be removed from the event ticker.
The import runs and refreshes the Event tickers dockable every period. The period is defined in the Advanced workspace settings. By default, the period is 60 seconds.
Create custom event tickers
These additional views are known as custom event tickers. These can have different filters from the primary event ticker.
To create a custom event ticker, follow these instructions:
- Right-click the event tickers tab.
- Click New Tab.
- Right-click the column and select the columns you want to display in your custom event ticker tab.
Event ticker filters
These filters determine which events appear on the event ticker tab.
The filter options have the following effects:
| Field | Description |
|---|---|
| Severity |
Defines the severities you are interested in. Example values: |
| Time | Allows you to define an absolute time period within which you want to see events or a period relative to the current time. |
| Description | Applies filter on the description field of events, matching all or parts of their content |
| Netprobe, Managed Entity, Sampler, DataView |
Allows you to filter the events based on the contents of these columns. These are simple string matches, including a partial contain and not contain functions. |
| Max Rows |
Defines the maximum number of events you want to see in your list at any given time. Default: 2000 |
| State Tree | Shows all events that occurred on the data item currently selected in the state tree (or one of its children). |
| Attributes |
Limits the events based on view path attributes. If you right-click this row, you can add attributes that are known based on your currently connected Gateways. Example values: Country, Department, Location, OS |
| Type | Limits the displayed events based on their type. |
Once a filter is applied, a filter bar in yellow appears in the relevant event ticker. This informs you that a filter is being applied to that event ticker.
Note: Whenever new events occur, these are added to all the event tickers. However, this may not appear due to the condition set in the event ticker's filter.
Event commands
It is possible to specify commands to run locally against ticker event attributes. The commands are specified in the ActiveConsole.gci file.
The commands are specified like this:
-eventcommands

name=<Command Name>        workingdir=<Directory Path>        execute=<Path>        arguments=<StaticArg>|$(<DynamicArg>)...
| Parameter | Description | Example |
|---|---|---|
| name | Display name of the command. | Telnet to probe |
| workingdir | Working directory of the command. | C:\Work |
| execute | Executable or script to run. | telnet.exe |
| arguments | Formatted arguments. | Type=$(_event_type) |
Arguments
Static and Dynamic are the two types of arguments.
Static arguments are passed as is from the argument, while the Dynamic arguments are substituted at runtime with values from the event.
Dynamic arguments have two types that are the Event attribute and XPath.
| Argument type | Specification | Example |
|---|---|---|
| Event attribute | $(_event_<attribute>) | $(_event_description) |
| XPath | $(<xpath>) | $(parameters/@Name) |
XPath arguments evaluates against the data item in the event, if it has one. While, the Event attribute arguments extract an attribute from the event.
Here are all the attributes:
| Attribute | Description | Specification |
|---|---|---|
| gateway | Gateway name. | $(_event_gateway) |
| eventId | ID of the event. | $(_event_eventId) |
| gatewayId | Gateway ID. | $(_event_gatewayId) |
| dateTimeStamp | Date and time. | $(_event_dateTimeStamp[<format>])* |
| severity | Severity of the event. | $(_event_severity) |
| triggerOn | What the event is triggered on. | $(_event_triggerOn) |
| triggerBy | What the event is triggered by. | $(_event_triggerBy) |
| triggerDataValue | Data value that triggers the event. | $(_event_triggerDataValue) |
| description | Event description. | $(_event_description) |
| path | Path of the data item. | $(_event_path) |
| type | Event type. | $(_event_type) |
| uniqueID | Unique id of the event. | $(_event_uniqueID) |
| triggerOnXPath | Xpath of the triggerOn attribute. | $(_event_triggerOnXPath) |
Note: The <format> in the dateTimeStamp specifies a
date formatting string.
Here is an example of specifying event commands:
-eventcommands

name=My Ticker Command
        workingdir=C:\User\jsmith
        execute=C:\Program Files\MyApp\go.exe
        arguments=Day $(_event_dateTimeStamp[E])) Name $(parameters/@Name)

name=My Ticker Command
        workingdir=C:\Program Files\Telnet\
        execute=telnet.exe
        arguments=$(../parameters/@HostName) $(_event_type)
Further reading
To know more about database logging in the Gateway Setup Editor, see Gateway Database Logging.
To know more about Gateway connections, see Gateways Dockable.