If you are currently using version 5.x.x, we advise you to upgrade to the latest version before the EOL date. You can find the latest documentation here.
ITRS Synthetic monitoring Technical Reference
Overview
ITRS Synthetic Monitoring (powered by Apica) allows you to monitor websites, web applications, and web services. The integration with Geneos enables you to retrieve all the checks and alert statistics configured in the Apica dashboard and display them as dataviews in Geneos.
The ITRS Synthetic Monitoring integration provides a Gateway configuration file that enables monitoring of the Apica environment through a set of pre-configured Toolkit samplers. The script can be configured by a set of environment variables and command line options.
This technical reference provides information on the metrics and dataviews for the samplers available through the integration. If you are setting up the integration for the first time, see the ITRS Synthetic Monitoring User Guide.
Audience
This technical reference is intended for users who will be using Active Console to monitor data from the Apica environment. If you are setting up the integration for the first time, see the ITRS Synthetic Monitoring User Guide.
Environment configuration
The default environment configuration is created by the apicaMonitoring.xml script. You can create a new environment or modify the default ApicaConfiguration environment variables according to your system.
Environment variables
The apicaMonitoring.xml script provides the variables that are set in the Environments section. They are configured to ensure that the integration monitors your target Apica environment.
| Variable | Type | Description |
|---|---|---|
| APICA_USER | String |
Username you are connecting with. |
| APICA_PASS | String |
Password for the specified user. |
| APICA_SVR | String |
Server you are connecting to. |
| PYTHON_PATH | String | Location of the sampler script. It can change depending on the environment. |
| GROUPNAME | String | Folder name of the dataview group. |
| APICA_SAMPLETIME | Integer | Amount of time for dataviews to resample (in seconds). |
Command line options
Command line options can be used instead of, or along with, the Environment variables.
| Option (long) | Option (short) | Type | Description |
|---|---|---|---|
| --user | -u | String |
Username you are connecting with. |
| --password | -pw | String |
Password for the specified user. |
| --server | -s | String |
Server you are connecting to. |
For example:
- If you want to retrieve a particular group using a command line option:
$ ./scripts/Get_Apica_Checks.py -s <server> -u <username> -pw <password> -g YourGroup "GroupBAR"
- If you want to retrieve a particular group using environment variables:
$ export APICA_SERVER=<server>
$ export APICA_USER=<username>
$ export APICA_PASS=<password>
$ export APICA_GROUP_A=YourGroup
$ export APICA_GROUP_FOO="GroupBAR"
$ ./scripts/Get_Apica_Checks.py
- When you declare both groups and subgroups, the script iterates through each check group and looks for the specified subgroups. You can use environment variables or command line options for this.
Command line options:
$ ./scripts/Get_Apica_Checks.py -s <server> -u <username> -pw <password> \
-g YourGroup \
-sg YouSubGroup "SubGroup FOOBAR";
Environment variables:
$ export APICA_SERVER=<server>
$ export APICA_USER=<username>
$ export APICA_PASS=<password>
$ export APICA_GROUP_A=YourGroup
$ export APICA_SUBGROUP_A=YourSubGroup
$ export APICA_SUBGROUP_FOO="SubGroup FOOBAR"
$ ./scripts/Get_Apica_Checks.py
-
You can combine environment variables with the command line options:
$ export APICA_SERVER=<server>
$ export APICA_USER=<username>
$ export APICA_PASS=<password>
$ export APICA_GROUP_A=YourGroup
$ ./scripts/Get_Apica_Checks.py -g "GroupBAR" -sg "SubGroup FOOBAR"
Metrics and dataviews
The sections below list metrics and example dataviews available with the Synthetic Monitoring integration.
By default, the integration displays dataviews from the following samplers:
- Apica-AllChecks
- Apica-Severity.
Two additional dataviews are available when you set up the following samplers:
- Apica-GroupChecks
- Apica-SubGroupChecks.
If you want to drill down to more details of a metric, follow these steps:
- Right-click a field with an information icon
- Go to Knowledge base.
- Click Apica Check Page.
You are redirected to Apica dashboard with the details of the selected metric.
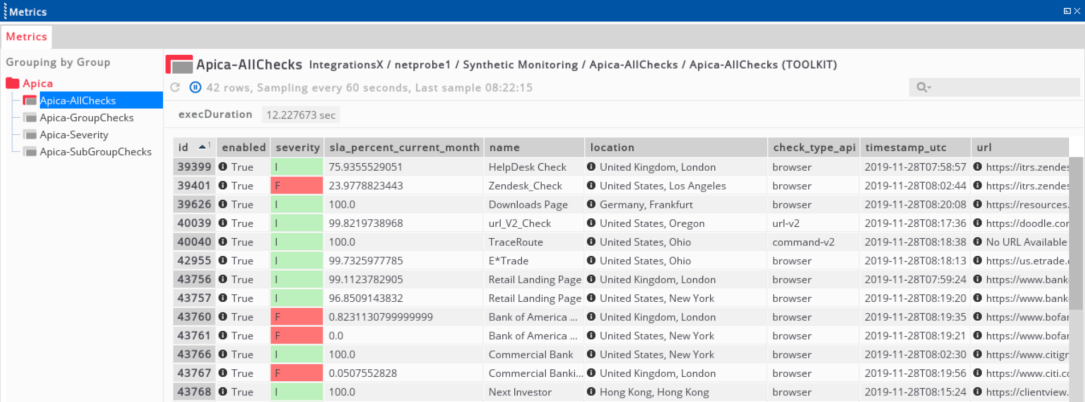
Apica-AllChecks
This dataview displays all metrics of the configured checks from your Apica environment.
| Headline field | Description |
|---|---|
| execDuration |
Elapsed time for the Toolkit plug-in to run the script. Unit: seconds |
| Column Name | Description |
|---|---|
| enabled | Flag indicating whether the check is enabled or not. If the check is disabled, it will not run. |
| severity |
Severity type. The following severities are available: I — Information W — Warning E — Error F — Fatal |
| sla_percent_current_month | SLA percentage for the specified time threshold, in this case current month. |
| name | Name of the check. |
| location | Country and city of origin for the check. |
| check_type_api |
Check type API Example: browser |
| check_type_name |
Check type name Example: Firefox |
| timestamp_utc | Time when the last check ran (UTC). |
| url | Target URL for the check. |
| message | Messages generated by the check. |
| value (unit) | Value returned for the check. The value and units depend on what is configured for the specific check (for example: total page size - bytes, total browser render time - milliseconds). |
| interval_seconds | Frequency of execution of the check. If checks are executed manually, the value is shown as 0. |
| attempts | Number of attempts that can be made to verify the results. |
| groups | Name of a group that is checked. |
| subgroups | Name of a subgroup that is checked. |
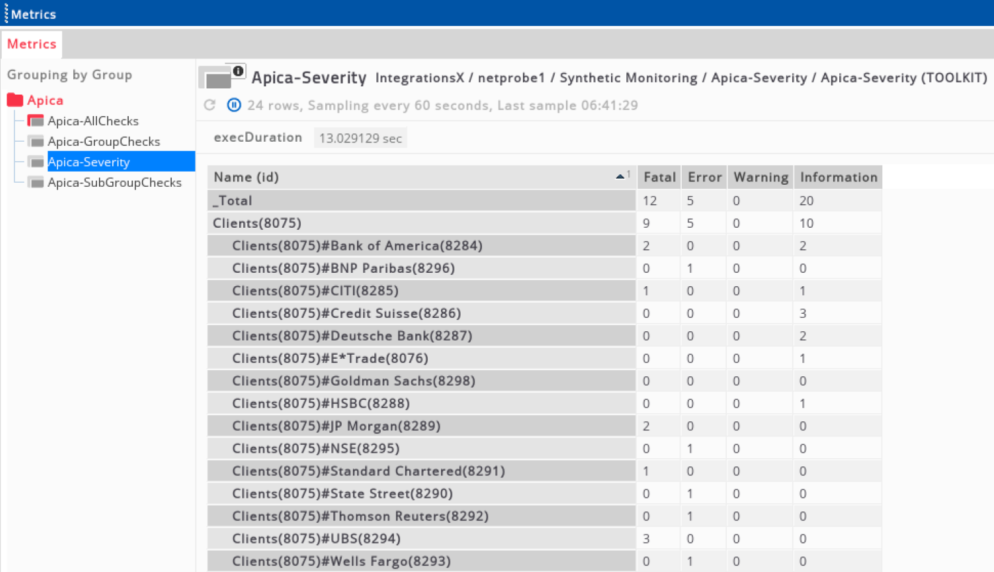
Apica-Severity
| Headline field | Description |
|---|---|
| execDuration |
Elapsed time for the Toolkit plug-in to run the script. Unit: seconds |
| Column Name | Description |
|---|---|
| Name (id) | Name of a group and subgroup. Subgroup names are indented. |
| Fatal | Number of alerts that are of Fatal severity type. |
| Error |
Number of alerts that are of Error severity type. |
| Warning | Number of alerts that are of Warning severity type. |
| Information | Number of alerts that are of Information severity type. |
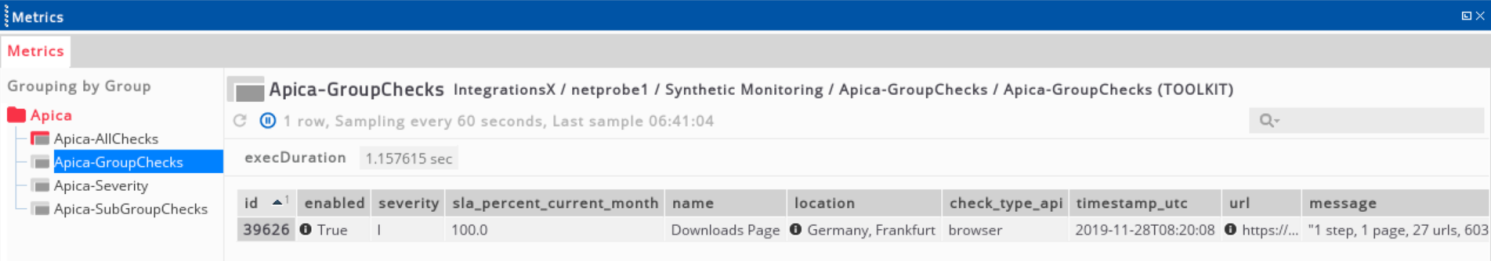
Apica-GroupChecks
This dataview displays all metrics of the configured checks relevant to the selected Groups.
Apica-GroupChecks sampler is configured using the same keys as Apica-AllChecks sampler. Refer to the Apica-AllChecks for more information.
By default, this sampler is not set up to display a dataview. You need to configure it to be able to view the metrics by associating it with a managed entity.
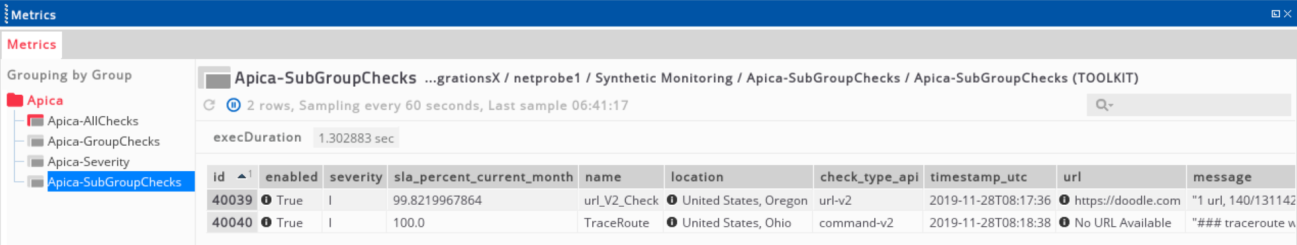
Apica-SubGroupChecks
This dataview displays all metrics of the configured checks relevant to the selected SubGroups.
Apica-SubGroupChecks sampler is configured using the same keys as Apica-AllChecks sampler. Refer to the Apica-AllChecks for more information.
By default, this sampler is not set up to display a dataview. You need to configure it to be able to view the metrics by associating it with a managed entity.
Further reading
To learn more about setting up the Synthetic Monitoring samplers on a Gateway, see the ITRS Synthetic Monitoring User Guide.