Obtain diagnostics
Check your Gateway Hub licence status
- Access your Web Console using your browser.
- Click Administration > Licence to navigate to the Licence page.
The status of your Gateway Hub licence is displayed in the General section.
Configure self monitoring
Each Gateway Hub node includes an internal Netprobe that can be used to monitor the node's performance.
To configure Gateway to show data from internal Netprobes, see Gateway Hub integration.
Obtain logs
By default Gateway Hub stores log files in the <hub_root>/logs directory. You can optionally specify another directory when installing.
Log retention policies
You can adjust the default log retention policies by editing the log configuration files.
| Service | Default retention | Configuration file |
|---|---|---|
| hub-svc-* | maxHistory: 60 daystotalSizeCap: |
/usr/share/hub-svc-*/conf/logback.xml |
Note: The asterisk * symbol indicates a wildcard which can take any value. For example hub-svc-snapshotd.
Obtain an info file
An info file containing basic information about your Gateway Hub installation can be sent to ITRS support to help diagnose problems with your Gateway Hub instance. You obtain this file using your Web Console.
For an introduction to the Web Console, see Access Geneos Web Console.
To obtain an info file, follow these steps:
- Access your Web Console using your browser.
- Click About ITRS Geneos to open the About page.
- Click the Get Diagnostic Info button to start the download.
This creates a Info.txt file in your default downloads folder.
Obtain a diagnostic file from the command line
You can create a comprehensive diagnostics file that packages the Gateway Hub log files from each node in the cluster as well as system information about the cluster and attached storage.
To obtain a diagnostic file from the command line, on any node run:
hubctl diagnostics <config_file>
This creates a temporary file on each node and downloads the all these files to your local machine. The location of the file is printed to stdout.
Obtain query request payloads
All data that is available in the Web Console is obtained from the REST API, this means that you can also access that data by making requests directly. For full documentation of the REST API see Gateway Hub REST API v1alpha.
To quickly identify request payloads to fetch data from the REST API you can use your browsers development tool to observe the requests sent by the Web Console.
-
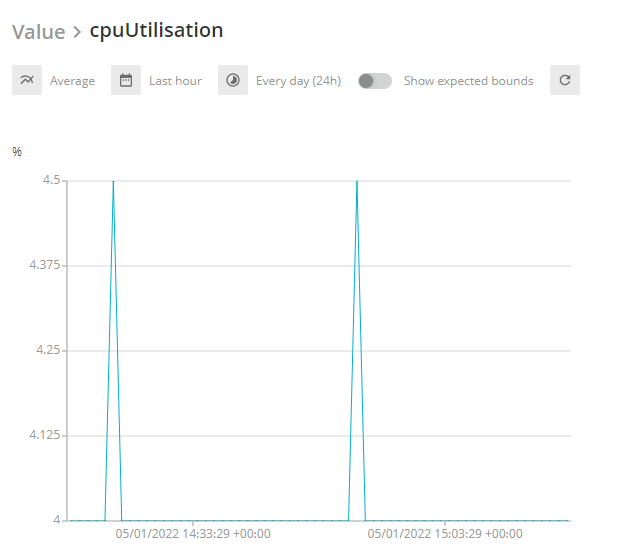
Navigate to the Web Console page that contains the data you are interested in. For example, the metric history of an entitiy.
-
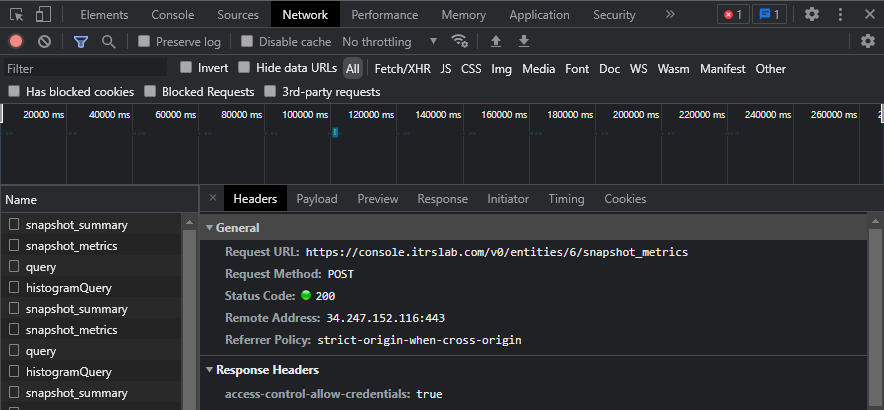
To open developer tools use the keyboard short-cut Ctrl + Shift + I or navigate to
More tools > Developer tools. This will open a new panel on the left. -
Select Network from the topmost tab bar. You may be prompted to reload the page before network information can load.
-
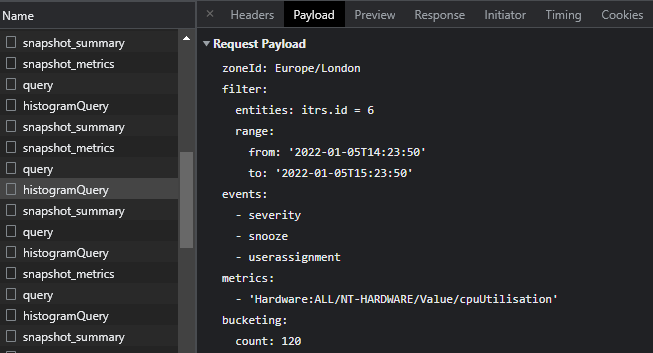
The Network view is composed of two panels. The left panel shows all requests, you can select any request to view information about it in the right hand panel. Select a request and then select the Payload tab to see the request payload sent by the Web Console.
Caution: These steps are correct for chromium based browsers. Other browsers, such as Firefox or Safari, also include development tools but the exact steps to view request payloads may be different.
Procedures
Verify the REST endpoint is reachable
Use a browser, a dedicated client such as Postman, or curl -k in the command line, to query the REST address followed by /v0/admin/info. The default REST address is https://<hostname>:8081.
If the REST endpoint is reachable, this returns output similar to below:
{
	"buildDateTime": "2020-08-13T17:17:46.297Z",
	"version": "2.2.0",
	"gitCommit": "ad4b43309b01ce0a5dd350f91673cceed05e4e3f",
	"gitCommitDateTime": "2020-08-13T17:17:16Z",
	"gitBranch": "release-2.2.0",
	"javaInfo": {
		"vendor": "Oracle Corporation",
		"version": {
			"major": 1,
			"minor": 8,
			"patch": 0,
			"update": 242,
			"arch": "x64"
		},
		"vm": "OpenJDK 64-Bit Server VM"
	},
	"os": {
		"name": "Linux(3.10.0-1127.el7.x86_64)",
		"other": ["CentOS Linux release 7.8.2003 (Core)", "NAME=\"CentOS Linux\"", "VERSION=\"7 (Core)\"", "ID=\"centos\"", "ID_LIKE=\"rhel fedora\"", "VERSION_ID=\"7\"", "PRETTY_NAME=\"CentOS Linux 7 (Core)\"", "ANSI_COLOR=\"0;31\"", "CPE_NAME=\"cpe:/o:centos:centos:7\"", "HOME_URL=\"https://www.centos.org/\"", "BUG_REPORT_URL=\"https://bugs.centos.org/\"", "CENTOS_MANTISBT_PROJECT=\"CentOS-7\"", "CENTOS_MANTISBT_PROJECT_VERSION=\"7\"", "REDHAT_SUPPORT_PRODUCT=\"centos\"", "REDHAT_SUPPORT_PRODUCT_VERSION=\"7\"", "Linux version 3.10.0-1127.el7.x86_64 (mockbuild@kbuilder.bsys.centos.org) (gcc version 4.8.5 20150623 (Red Hat 4.8.5-39) (GCC) ) #1 SMP Tue Mar 31 23:36:51 UTC 2020"]
	}
}
Resolve an ingestion error
The Web Console home page has a dashboard widget that shows the total number of ingestion errors. Details of each error is shown on the Ingestion Errors page.
To navigate to the Ingestion Errors page, either:
- Click the widget on the Web Console home page.
- Expand the Administration panel on the left-hand side of the Web Console and click Ingestion Errors.
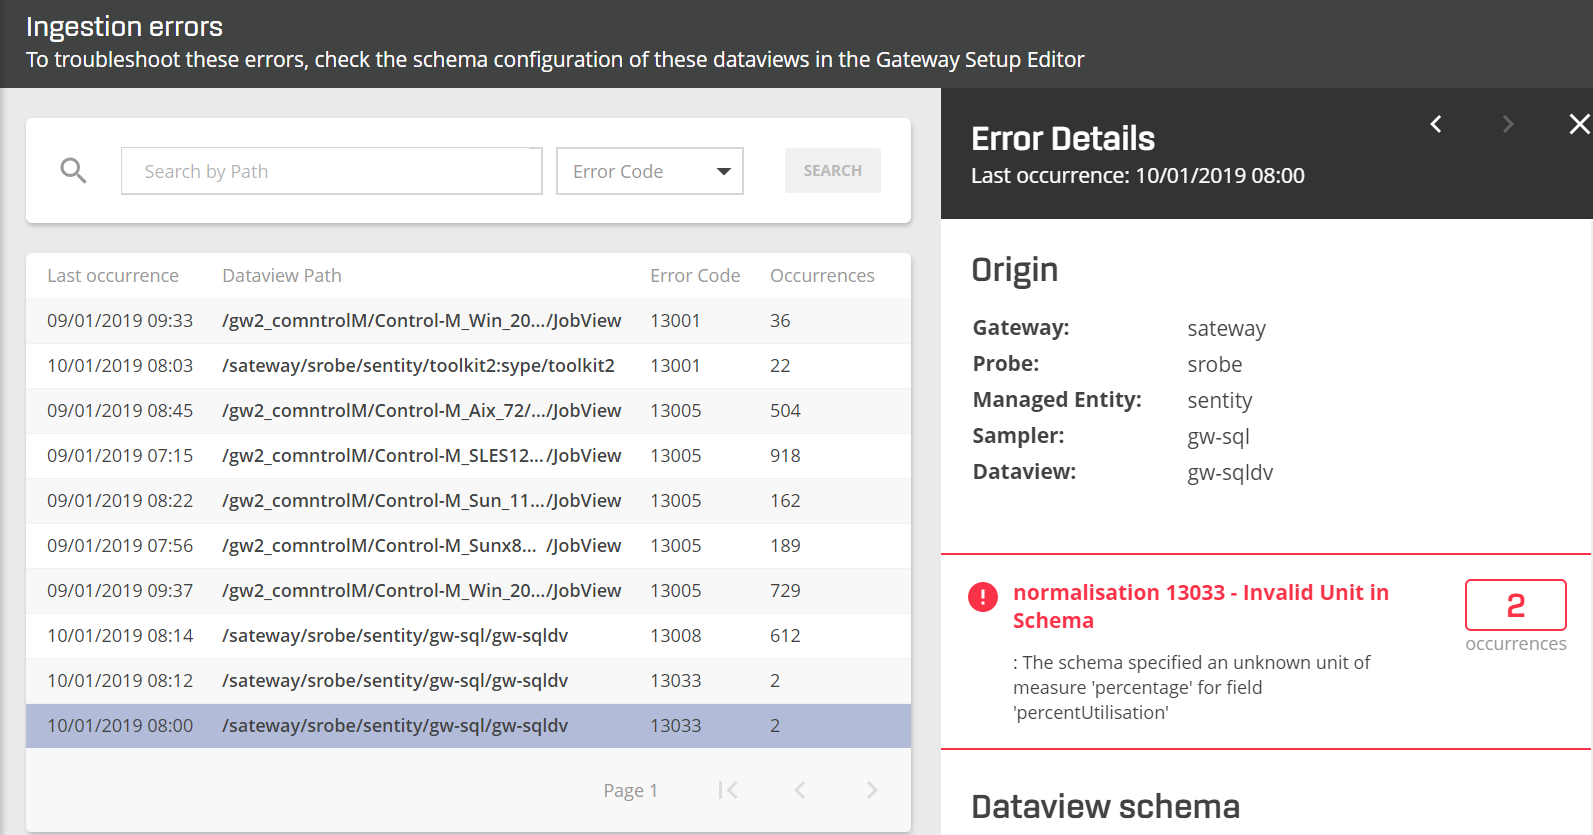
The Ingestion Errors page displays a table of errors, grouped by Dataview and Error. For a list of the columns and their meaning, see Ingestion errors
Selecting an error in the list to reveals the error details sidebar. This contains further information about the error such as the origin of the error and the currently configured schema.
To resolve an ingestion error, follow these steps:
- Access your Web Console using your browser.
- Click Administration > Ingestion Errors to navigate to the Ingestion Errors page.
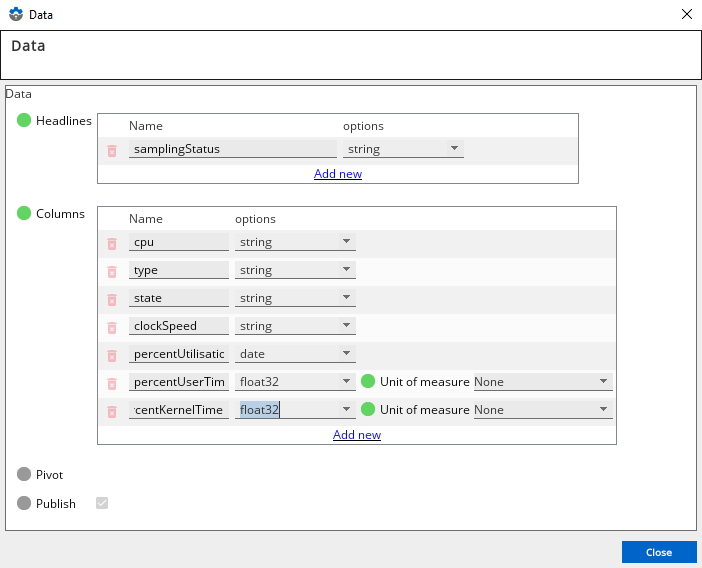
- Select an error from the list to view the Error Details sidebar. The Error Details screen provides the information, including the affected Gateway and sampler in your setup.
- Open the dataview in Active Console to confirm the actual values.
- Open your Gateway Setup Editor.
- Navigate to the Publishing tab of the relevant sampler.
Using the example above, the relevant sampler is gw-sql. - In Schemas > Dataviews, click Data to open the schema configuration for the relevant dataview in the sampler.
- On the Data screen, correct the schema as required.
In this example, the correct unit of measure is selected using the Unit of measure field. - Click Close to close the window.
- Click Save current document
 to save the setup.
In the example below, the error message is 13033 - Invalid Unit in Schema.
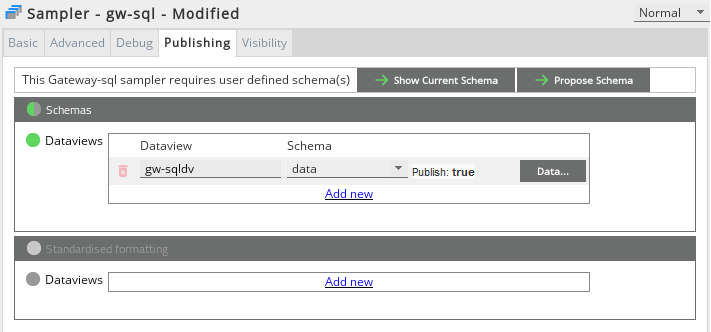
Success: Once the updated schema is saved, Gateway Hub will be updated and the previous error is removed from the system.
Remove ingestion errors
Gateway Hub deletes old ingestion errors after seven days.
However, if you accumulate stale ingestion errors you may want to manually remove them.
To remove ingestion errors, perform the following steps on each node:
-
Navigate to Gateway Hub's built-in PostgreSQL database. By default, this is located at
/opt/hub/hub-<hub_version>/services/postgres-timescale-<version>. -
Start a SQL prompt:
./run-psql.sh
-
Connect to the database
hubas the userpostgres:\c hub
-
Delete the ingestion errors:
DELETE FROM errors;
DELETE 0
-
Exit the SQL prompt:
exit
Note: Since you cannot perform SQL operations simultaneously on all nodes, some inconsistencies may occur.
Obtain the Subject Alternative Name of a certificate
You can extract the Subject Alternative Name from a certificate using the OpenSSL command line tool. This allows you to ensure it matches the Gateway Hub domain. For more information, see
Note: If you are using non self-signed TLS certificates, make sure that both server and client authentication are enabled. Otherwise, you might get a certificate verification error.
To extract the Subject Alternative Name, run:
openssl x509 -in <certificate_file> -text -noout
Which will return output similar to:
X509v3 Key Usage:
    Digital Signature, Non Repudiation, Key Encipherment
X509v3 Extended Key Usage:
    TLS Web Server Authentication, TLS Web Client Authentication
X509v3 Subject Alternative Name:
    DNS:DNS-name-1, DNS:DNS-name-2, ...
Add Gateway Hub certificate authority to Grafana
In order for Grafana to connect to Gateway Hub securely, the certificate authority (CA) that has signed the TLS/SSL certificate used by Gateway Hub must be trusted by the system running Grafana.
If Gateway Hub is installed using certificates signed by an non-trusted CA, including the internal CA, you must add the relevant CA certificate to the trust store of the Grafana host. If Gateway Hub has been configured using production certificates that are trusted across an organisation, this is not required.
If you attempt to connect Grafana and Gateway Hub using non-trusted certificates, the connection will fail and Grafana will receive no data. The server logs will include a Failed to get access token error and state certificate signed by unknown authority.
To add Gateway Hub to a system's recognised certificate authorities:
- Locate the CA certificate used to sign Gateway Hub certificates. In a default installation, using an internal CA, this is
/opt/hub/hub-version-GA/tls/trust-chain.pem. - Copy the CA certificate to the trust store of the Grafana host. In a or Red Hat system this is located at
/etc/pki/ca-trust/source/anchors/. - To update the recognised certificate authorities, run:
update-ca-trust extract
- You can verify the updated list by running:
trust list
- You can verify the updated list by running:
- Restart Grafana.
- In the Grafana web interface, open the ITRS Geneos Gateway Hub Datasource settings and disable
Skip TLS Verify.
Restart Capacity Planner application
To restart the Capacity Planner application, perform the following steps on each Gateway Hub node:
-
Navigate to the
<hub_install_dir>/hub-current/bindirectory. -
Run the following command:
hub-admin service restart -n capacity-planner
Test a Gateway connection
When configuring a Gateway to publish data to Gateway Hub you may encounter a GatewayHubPublishing Failed sending: Local: Unknown topic error. This occurs when a Gateway cannot find the required topics or cannot connect to any brokers.
To diagnose the cause of the error use the kafkacat tool to test the connection to Gateway Hub and fetch a list of metadata, including topic names.
Run the kafkacat command, specifying as options each of the Additional Settings required by the Gateway Setup Editor. These options have the form -X setting.name=value where the setting.name matches the corresponding Additional Setting omitting the kafka prefix.
You should provide the same credentials used when configuring the connection in the Gateway Setup Editor. For more information, see Connect a Gateway in Connect a .
kafkacat -X security.protocol=ssl -X ssl.ca.location=<hub_CA_certificate> -b <hostame>:9092 -L
If kafkacat returns a list of topics that does not include geneos-events or geneos-metrics-v1, the Gateway will not be able to publish metrics to Gateway Hub. You should check the Gateway Hub configuration.
If kafkacat cannot connect to Gateway Hub, the Gateway will also be unable to connect. You should check the network connection.
Kafkacat
The kafkacat tool is an open source utility written and maintained by the author of the librdkafka library used by Geneos. This utility is shipped with Linux 64-bit Gateways to ease the testing of connecting to your Kafka infrastructure. For more information about kafkacat, see kafkacat Github.
To ensure that kafkacat uses the same Kafka and SSL libraries as the Gateway, kafkacat must be run with the following environment variables:
LD_LIBRARY_PATH— this must point at the lib64 library supplied as part of the Gateway bundle.
Increase Kafka message size for centralised configuration validation
When running a Gateway using central configuration, setup files are validated by Gateway Hub.
Gateway Hub uses Kafka messages to distribute Gateway setup files to a dedicated daemon that validates them. If the setup file size is large, it may exceed the default Kafka message limit of 1 MB. In this case, Gateway Hub is unable to validate files and the Gateway setup files cannot be saved.
To resolve this issue, you must increase the maximum Kafka message size for Gateway setup validation.
However, the following additional memory limitations still apply:
- HTTP server request size (
8 MiB) - etcd message size (
2 MiB) - gRPC message size (
4 MiB)
If any of these are exceeded, Gateway setup files cannot be saved.
Caution: Kafka messages over 8 MB in size will also breach the maximum HTTP server request size of the API Daemon.
Diagnose
The Kafka message size may be too small if both of the following behaviours are occurring:
- Gateway validation in the Gateway Setup Editor is unable to complete.
- The following appears in the API Daemon logs:
2020-09-28 11:47:04.479Z ERROR [default-akka.actor.default-dispatcher-3] [ValidationQueryRequesterImpl] - Unhandled Kafka Exception publishing to topic 'unknown'
org.apache.kafka.common.errors.RecordTooLargeException: The message is 6747120 bytes when serialized which is larger than the maximum request size you have configured with the max.request.size configuration.
2020-09-28 11:47:04.479Z ERROR [default-akka.actor.default-dispatcher-3] [ValidationQueryRequesterImpl] - Failed to publish validation query
org.apache.kafka.common.errors.RecordTooLargeException: The message is 6747120 bytes when serialized which is larger than the maximum request size you have configured with the max.request.size configuration.
Increase message size
To change the maximum Kafka message size for Gateway setup validation, perform the following steps:
- Open the API Daemon's Kafka configuration in your default text editor:
./hubctl/hubctl config edit -n apid -c apid.yaml installation-descriptor.yml
- In the kafkaProducer > properties section, specify the
max.request.sizein bytes. For example:# Kafka producer for publishing to the Hub Kafka cluster # https://kafka.apache.org/documentation/#producerconfigs kafkaProducer: properties: max.request.size: 5242880 bootstrap.servers: localhost:9092 acks: all key.serializer: org.apache.kafka.common.serialization.StringSerializer value.serializer: org.apache.kafka.common.serialization.ByteArraySerializer - Open the Gateway configuration Daemon's Kafka configuration in your default text editor:
./hubctl/hubctl config edit -n gateway-configd -c gateway-configd.yaml installation-descriptor.yml
- In the kafkaProducer > properties section specify the
max.request.sizein bytes, and in the kafkaConsumer > properties section specify thefetch.max.bytesin bytes. The configuration file should look similar to:# Kafka producer # https://kafka.apache.org/documentation/#producerconfigs kafkaProducer: properties: max.request.size: 5242880 bootstrap.servers: localhost:9092 security.protocol: SSL # Kafka consumer # https://kafka.apache.org/documentation/#consumerconfigs kafkaConsumer: properties: fetch.max.bytes: 5242880 bootstrap.servers: localhost:9092 security.protocol: SSL - Open the Kafka server configuration in your default text editor:
./hubctl/hubctl config edit -n kafka -c server.properties installation-descriptor.yml
- In the Replication Settings section, specify the
replica.fetch.max.bytesin bytes. The configuration file should look similar to:#### Replication Settings #### min.insync.replicas=3 replica.fetch.max.bytes=5242880
- Update the Kafka topic configuration. To do this, run the following on a Gateway Hub node:
<hub_root>/hub-current/services/kafka-2.12-2.5.0/kafka_2.12-2.5.0/bin/kafka-configs.sh --zookeeper localhost:5181 --entity-type topics --entity-name hub-gateways-validations-requests --alter --add-config max.message.bytes=5242880
<hub_root>/hub-current/services/kafka-2.12-2.5.0/kafka_2.12-2.5.0/bin/kafka-configs.sh --zookeeper localhost:5181 --entity-type topics --entity-name hub-gateways-validations-queries --alter --add-config max.message.bytes=5242880
Renew Gateway Hub server certificate
When installing Gateway Hub, you can choose to use self-signed certificates for TLS connections between Gateway Hub components.
The installer generates a self-signed CA certificate and uses it to sign the server certificate used by Gateway Hub. The CA certificate generated by the installer has a lifetime of 100 years. However, the server certificate has a lifetime of 397 days and you must generate a new certificate before it expires.
To generate a new server certificate, run:
hubctl setup reconfigure config.yml
Restore PostgreSQL database files on a node
If a PostgreSQL database file has been corrupted or deleted, you can restore PostgreSQL from another node. Since the PostgreSQL database is replicated across nodes, you can copy the entire database content from one node to another.
-
Stop the Gateway Hub service on all nodes.
If
systemdis managing Gateway Hub, run the following commands:sudo systemctl mask hub-orchestration
sudo systemctl stop hub-orchestration
If not, on each node, run:
/opt/hub/current/bin/hub.sh stop
-
Make sure that Gateway Hub is stopped on each node by running:
/opt/hub/current/bin/hub.sh
To check that PostgreSQL is effectively stopped, run:
ps -edf|grep postgres:
-
From a node with intact PostgreSQL database, create a TAR file for each of the following:
-
<hub data>/postgres-timescale/pgdata -
<hub data>/postgres-timescale/pgwal
-
-
Copy the created TAR files to the destination node.
-
On the destination node, rename the following paths for backup:
-
<hub data>/postgres-timescale/pgdatato<hub data>/postgres-timescale/pgdata.<timestamp> -
<hub data>/postgres-timescale/pgwalto<hub data>/postgres-timescale/pgwal.<timestamp>
-
-
On the destination node, unzip the TAR files copied from another node. This will create new
<hub data>/postgres-timescale/pgdataand<hub data>/postgres-timescale/pgwalfile paths. -
On the destination node, start PostgreSQL manually by running:
/opt/hub/current/services/postgres-timescale-<version>/start.sh
Confirm that you see the following messages in the logs:
LOG:  database system is ready to accept connections
LOG:  TimescaleDB background worker launcher connected to shared catalogs
-
On the destination node, stop PostgreSQL by using the keyboard short-cut CTRL + C.
-
Restart Gateway Hub normally using
hubctlorsystemd.