Events Viewer
Overview Copied
An Event is when a Host, Service Check, Business Service or Component changes state, e.g. if a host changes state from UP to DOWN. When this happens, an Event is generated which logs the date/time and other details. If the Host returns to UP 20 minutes later, another event will be generated to display this.
These events can be viewed within the Events Viewer. The Events Viewer section can be accessed by going to the Monitoring > Events Viewer menu.
Once loaded, you will be able to view all the events that have occurred within the Opsview Cloud system:
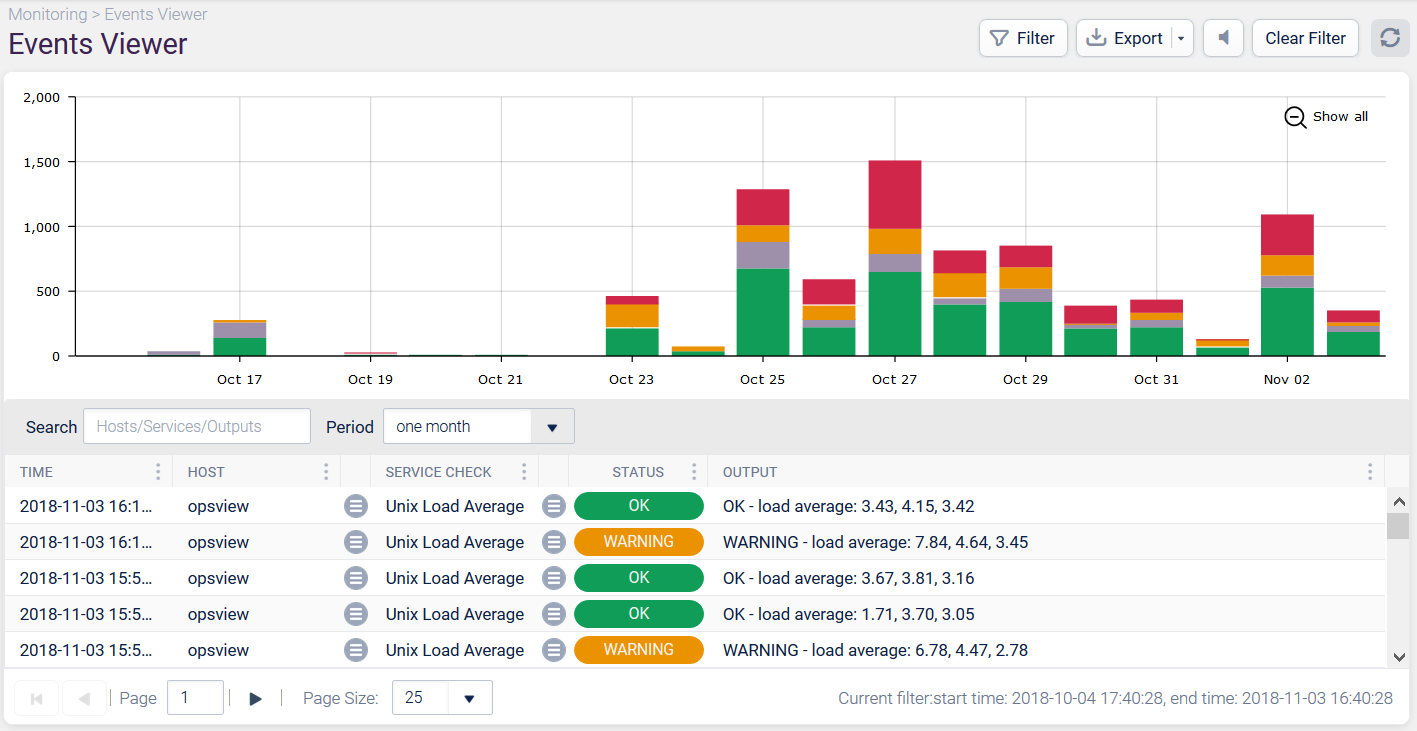
By default, the Events Viewer is filtered to display events that have occurred within the past six hours. The Events Viewer is split into two areas that provide with the same information in a graph and in a table for ease of use.
The Graph will display in a bar format all the events that occurred within a certain time period. These bars will group the events together, i.e. for a six-hour time period the bars represent a 10-minute time period; for a one-day time period the bars represent thirty minutes. The bars reflect the number of events that have happened in that time period. It does not represent the state of the system at that point in time. For example, if nothing happened between 3:00 pm and 4:00 pm, there would be no event - not a big green bar.
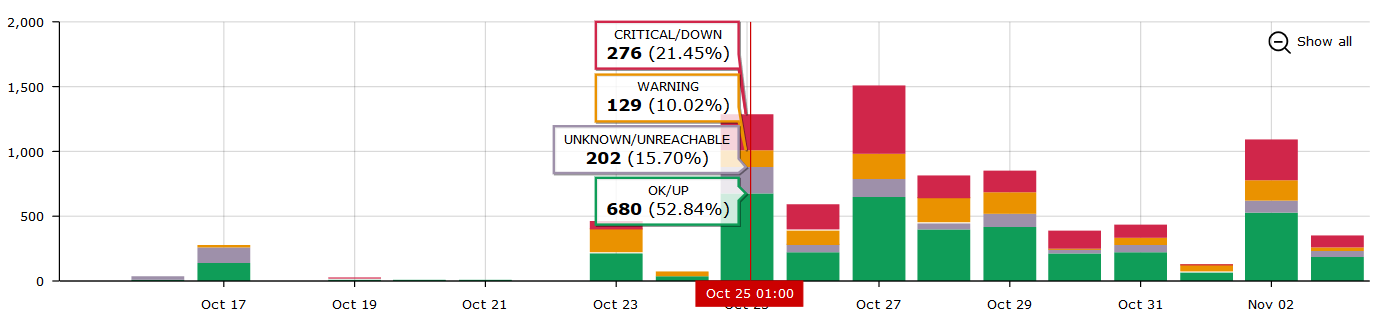
Each bar can have up to four separate colors that represent different statuses:
Red— CRITICAL Service Checks and DOWN Hosts.Yellow— WARNING Service Checks.Green— OK Service Checks and UP Hosts.Grey— UNKNOWN Service Checks and UNREACHABLE Hosts.
To view the count of each section, i.e. ‘How many Criticals at this point in time’, hovering your mouse over will display a count for each section in the selected bar.
The Table will display the detail of the bars displayed, with one event per row.
This data is linked to the Graph, meaning if there are four events displayed in the Table, then there will only be four events visible in the Graph.
At the top right of the Events Viewer page there is a refresh button allowing you to manually refresh the Events Viewer and receive the latest updates in the table and graph. This is set on an automatic countdown - you can hover over the button to see when it will next refresh. Right click the refresh button to stop or start the automatic countdown, or to modify the countdown duration.
Filtering the Events Viewer Copied
Filtering allows you to pin-point specific events within the Events Viewer that you wish to analyze and interpret. Within the Events Viewer there are four ways of filtering:
- Period
- Search
- Filter Button
- Selecting the bars on the Event Graph
Period Copied
To filter on date/time, you can use the ‘Period’ dropdown within the Event Table. You can choose the following options:
- 1 hour
- 2 hours
- 3 hours
- 6 hours
- 12 hours
- one day
- week
- one month
- custom - will allow you to select a specific date/time range.
- last full day - The last full 24 hour period (00:00 to 00:00).
- last full 7 days - The last 7 full 24 hour periods (00:00 to 00:00).
- last full week - The last full week e.g. if used on Tuesday, this would be the previous Monday - Sunday.
- last full month - The last full month e.g. if used on Feb 5th, this would be Jan 1st - Jan 31st.
Choosing ‘one day’ will display all events that have occurred between ‘one day ago’ until ’now’. You can chose any of the pre-set values or provide with a custom date/time range:
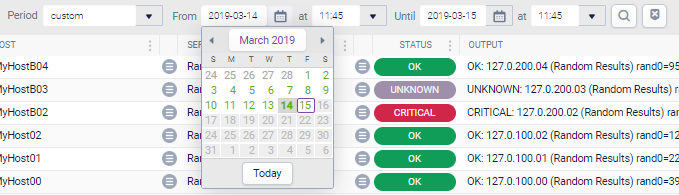
The modification of the ‘Period:’ field will re-populate both the Graph and Table with the relevant data.
Note
The longer the selected time period is, the more data will need to be retrieved, and the longer it may take to populate on screen.
Search Copied
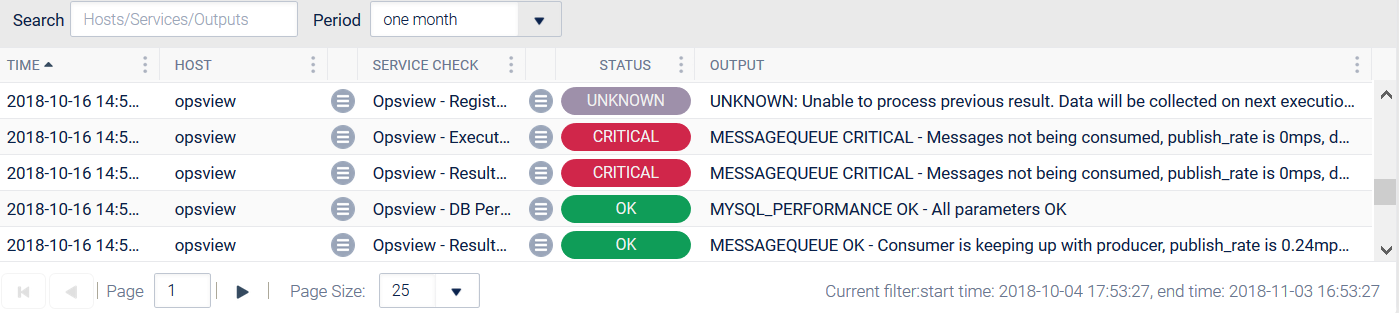
To undertake a text search, simply enter your search terms in the ‘Search:’ box and click ‘Enter’. This will search across the Hosts, Service Checks, and Output columns:
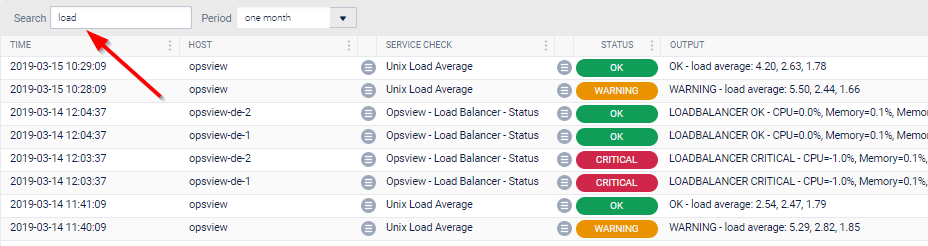
To clear the search filter, simply delete the text from the ‘Search:’ box and click ‘Enter’ or use the Clear Filter button.
Filter option Copied
The Filter button is located in the top right corner of the Events Viewer page.
Clicking the Fiter button opens a modal windowwhich has three or four filter tabs (depending on whether BSM is enabled or not). Multiple options within each of the three/four tabs can be selected, i.e. ‘Host State: DOWN/UNREACHABLE and Filter by Host: Opsview’, for example. The options are broken down as follows:
Hosts Copied
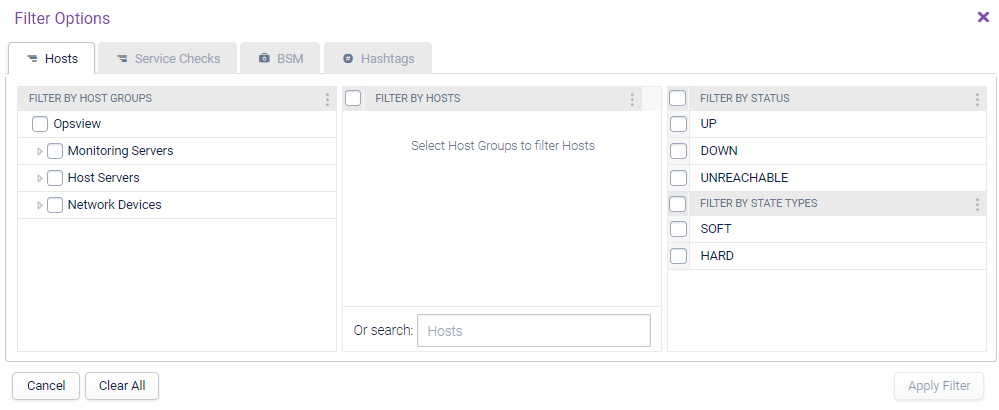
The following filter options are available for Hosts:
- Filter by Host Groups.
- Filter by Hosts.
- Filter by Status.
- Filter by State Types.
Regular expressions can be used to filter the host name.
Service Checks Copied
The following filter options are available for Service Checks:
- Filter by Service Checks.
- Filter by Status.
- Filter by State Types.
- Filter by Host Templates.
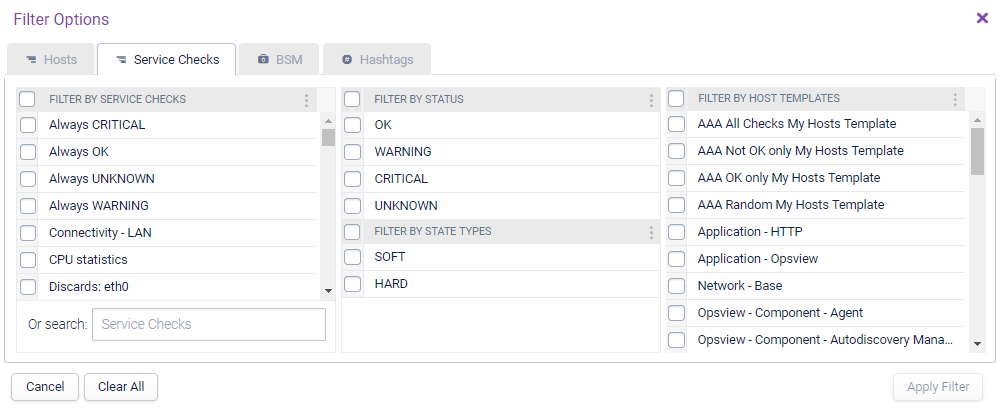
Regular expressions can be used to filter service checks.
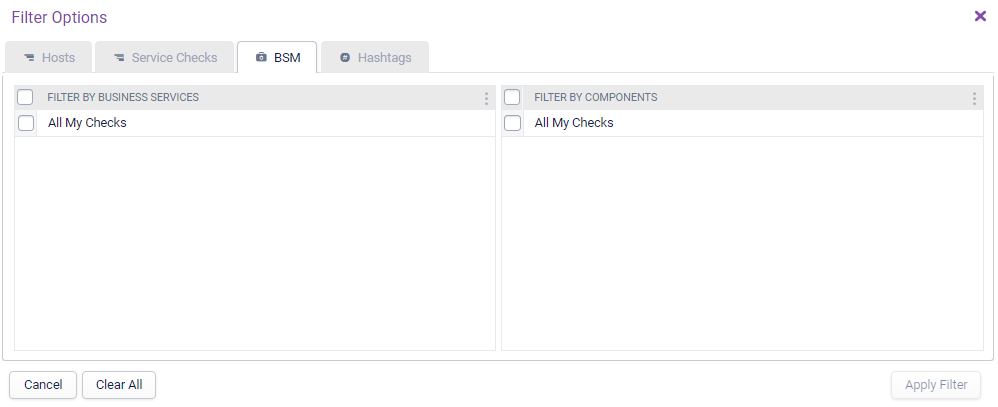
BSM Copied
The following filter options are available for BSM:
- Filter by Business Services,
- Filter by Components,
Hashtags Copied
The following filter options are available for Hashtags:
- Filter by Hashtags
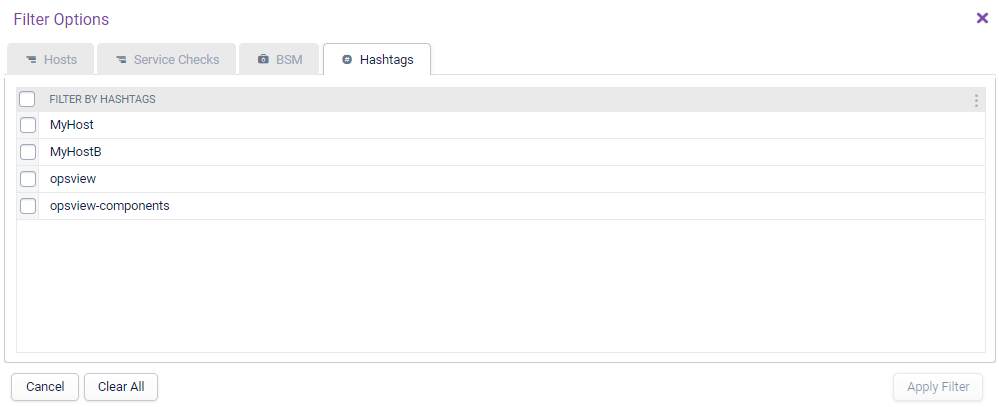
After selecting your desired filters, clicking on ‘Apply Filter’ which will repopulate the Events Viewer page with the relevant data.
You can use ‘Clear All’ at the bottom right of the modal window if you want to start over setting your filter selection.
Note
When you apply filtering, this is based on the current configuration and not historical. For instance, if you add a service to an existing hashtag today and then search in Events Viewer, Opsview will display the history of that new service yesterday even though it wasn’t part of the hashtag at that time. If this is important for you, then the Opsview Data Warehouse (ODW) stores “configuration over time”.
To clear the applied filters, click on the ‘Clear Filter’ button located in the top right corner of the Events Viewer page.
Selecting the bars on the Graph Copied
You can also filter the Events Viewer by clicking on one or more bars within the Graph.
In the example below, we have clicked on a single bar which has filtered the Table to reflect only Events from the timeframe represented by the selected bar. All other bars are slightly faded to emphasize the focus on the selected bar.
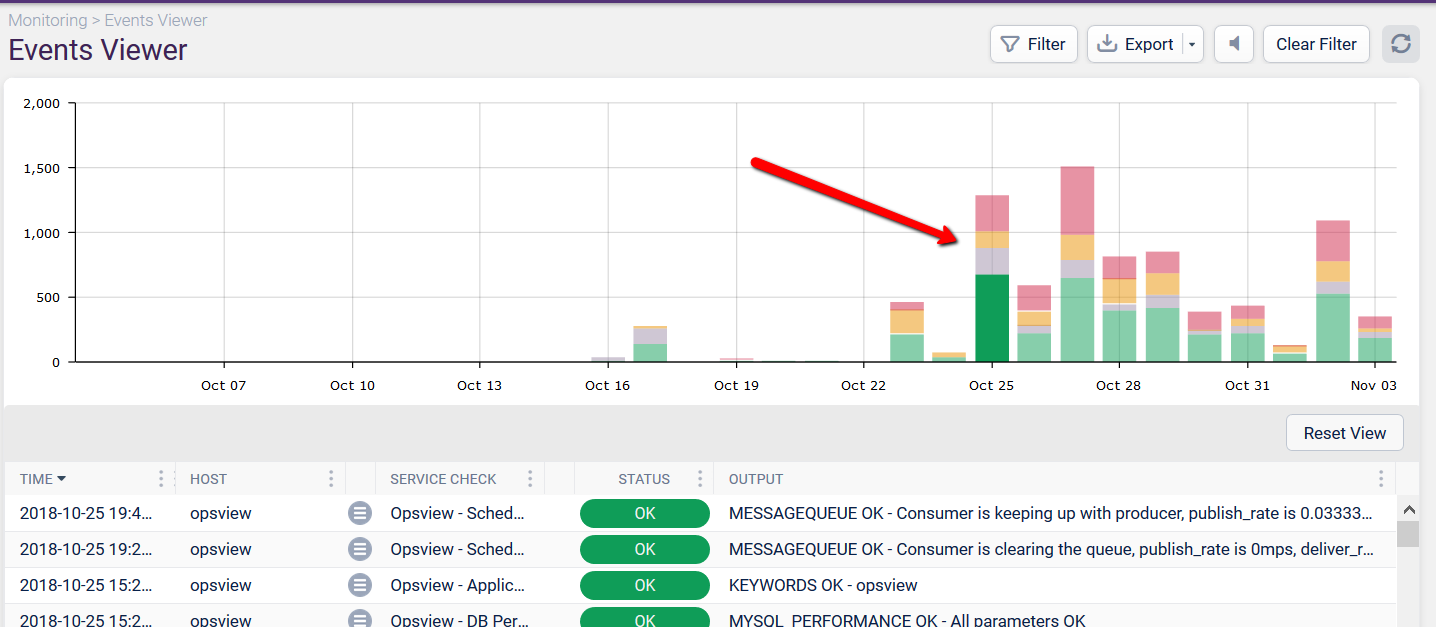
To clear the selected bars, simply click on the Reset View button at the top right of the Table.
Exporting Copied
The filtered Events Viewer data can be exported to the following formats:
.csv.json.xml
To export the data, simply click on the Export button and then choose the desired format.
Your browser will then offer to open or save the file to your computer.
Audible Alerts Copied
Events Viewer also has the ability to generate a notification sound whenever a new event appears within the Table.
To enable sounds, simply click on the Speaker icon. This will make a sound through your computer speakers (if enabled/un-muted) each time a new event appears within the Events Viewer.
To disable sounds, simply click on the Speaker icon again.