Opsview 6.8.x End of Support
With the release of Opsview 6.11.0 on February 2025, versions 6.8.x have reached their End of Support (EOS) status, according to our Support policy. This means that versions 6.8.x will no longer receive code fixes or security updates.
The documentation for version 6.8.9 and earlier versions will remain accessible for the time being, but it will no longer be updated or receive backports. We strongly recommend upgrading to the latest version of Opsview to ensure continued support and access to the latest features and security enhancements.
Classic Business Service Monitoring views
BSM Grid View Copied
The BSM Grid View displays Business Services that are sorted by status. A BSM with an offline state will be marked with a red color and will be positioned at the start of the grid.
A typical BSM will show the user information including status, availability, and operational details of the business service.
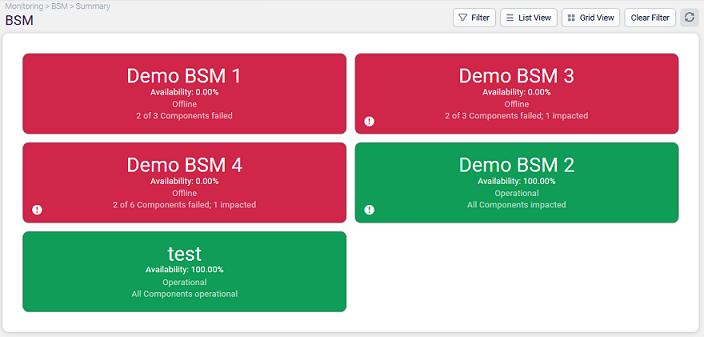
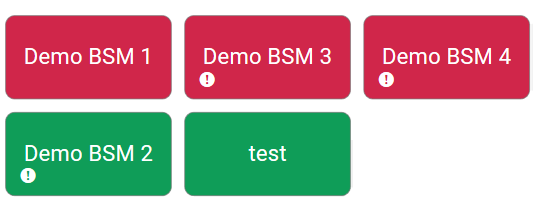
If the window is resized or there are a large number of business services you will notice that all the tiles are fitted to the view.
When space gets limited only certain information will be removed so all the business services can be viewed all in one view.
Filter options Copied
Filtering options are available through the ‘Filter’ button in the top-right toolbar.

In here the grid view can be filtered by individual business services and/or status. Any filtering that is set on the grid view is maintained if you move to the list view.
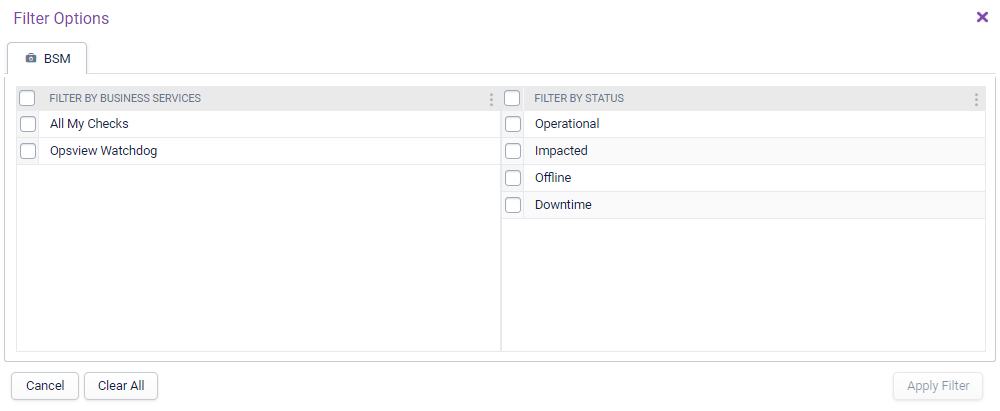
You can also clear a set filter by clicking the Clear Filter button.
Contextual Menu Copied
The contextual menu is available when you left-click on a Business Service.

There are various options that can be selected to interact further with each business service:
- New Investigate — will open a new tab with a detailed view of the selected business service in a new visualisation. See BSM Views for more details
- Classic Investigate — will open a more detailed view of the selected business service with associated components. See the below section Classic BSM Views.
- Schedule Downtime — will open a modal window allowing you to schedule downtime for service checks under that BSM Service, with a Start/End time and Comment.
- Recheck — will open a modal window allowing you to schedule rechecks for service checks under that BSM Service.
- Acknowledge — will open a modal window allowing you to acknowledge non-OK statuses for service checks under that BSM Service, with a Comment.
BSM List View Copied
To switch to List View, simply select the ‘List View’ button in the top right toolbar.
This page is a list of business services that are sorted by status. Offline services are always listed first. This display shows information including the status, availability and operational detail of the business services.
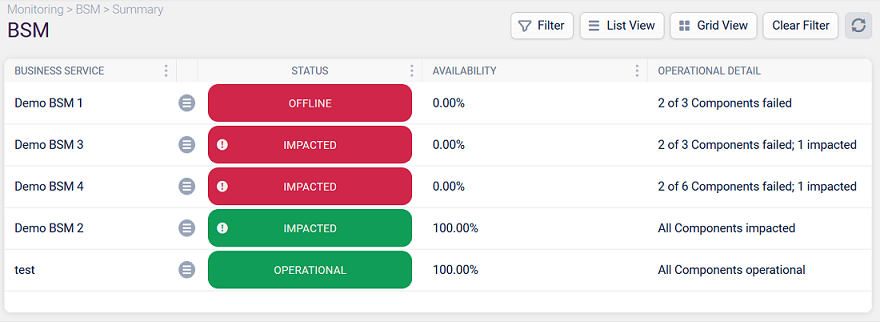
You can additionally sort the list by column in either ascending or descending order by clicking on the column name, or via the contextual menu icon for that column. This sorting will be maintained if you switch back to Grid View. Any filtering that is set in the list view is also maintained if you move to the grid page.
Within the status column, further detail is given depending on whether the business service is acknowledged or impacted.
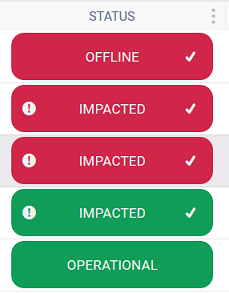
You can access the same contextual menu as in the Grid View by selecting the contextual menu icon for each row.

To switch back to the Grid View, click Grid View in the top right toolbar.
BSM Detail Page Copied
This page can be accessed from different places in the BSM Summary page:
- The Grid View by clicking on a Business Component and selecting Investigate.
- The List View by clicking on the hamburger menu next to a Business Component and selecting Investigate.
The page shows a detailed view of the selected Business Service and its Components including Status, Availability, Impacted and Acknowledgement states. This view also shows the Operational Zone of each Component as a grey box, allowing you to see how and why a particular Component is impacted.
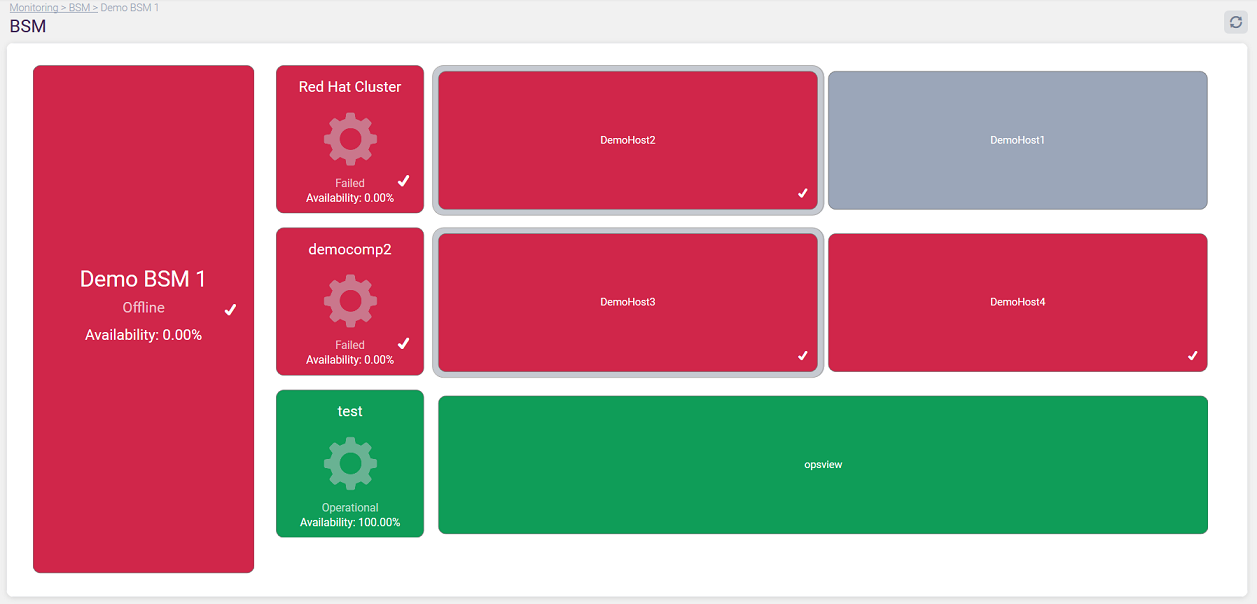
By clicking on the Business Service the contextual menu will show actions that can be carried, such as Schedule Downtime, Recheck and Acknowledge. The resulting change to the hosts will be visible on the next refresh of the page.
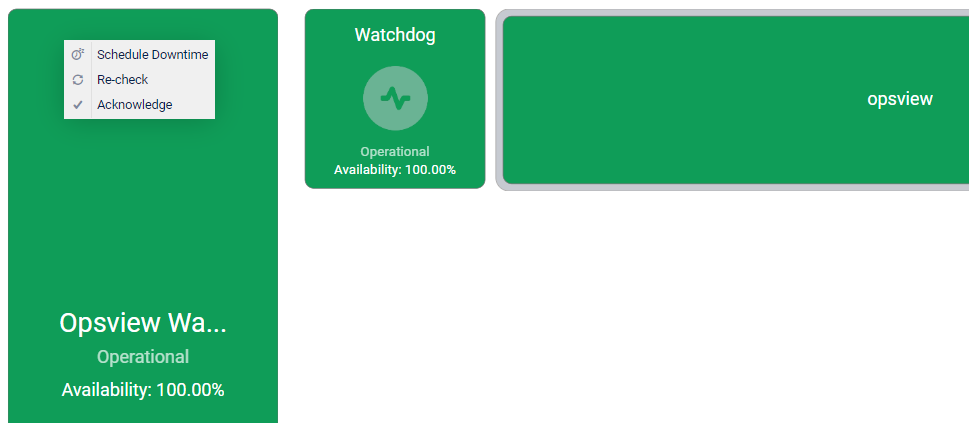
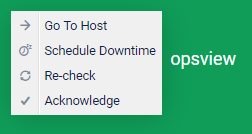
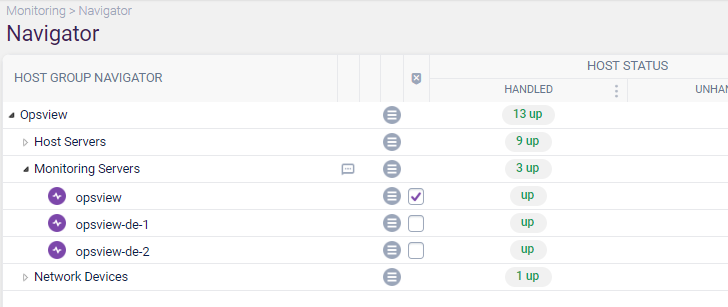
These actions can also be narrowed down on the individual Components to perform the actions only on the associated hosts. Additionally, opening the context menu for a host will provide the extra option Go To Host, taking you to the Navigator page with that host selected.
