Opsview 6.8.x End of Support
With the release of Opsview 6.11.0 on February 2025, versions 6.8.x have reached their End of Support (EOS) status, according to our Support policy. This means that versions 6.8.x will no longer receive code fixes or security updates.
The documentation for version 6.8.9 and earlier versions will remain accessible for the time being, but it will no longer be updated or receive backports. We strongly recommend upgrading to the latest version of Opsview to ensure continued support and access to the latest features and security enhancements.
Event Handlers
Overview Copied
Event Handlers are a feature within Opsview Monitor that moves your monitoring solution away from a detect and alerting system to a more proactive monitoring tool. What does this mean? Well, if Opsview Monitor detects that the web service is not running on a monitored host it can not only alert you, but it can also automatically restart the web service. This means that you will know a problem occurred so you can diagnose and ensure it doesn’t happen again. But at the same time, your users are not impacted as the Web Server is back online within seconds of the outage. This is done via an Event Handler.
For more information about Host and Services, States, Plugins, Notifications and Event Handlers concepts, please see Important Concepts.
Event Handlers are scripts that can be automatically run by Opsview Monitor when it detects that a host or service check has a result in any problem state. It is also executed when the first OK result is returned.
Note
Downtime and Acknowledged Service Checks will still have event handlers run.
Event Handlers sit on the monitoring server and are invoked via Opsview Monitor and will need to be installed on each collector.

The graphic above shows the relationship between Opsview Monitor, the Infrastructure Agent, and the Event Handler. The Collector runs the Event Handler when the service changes to a non-OK state. At the same time, the ‘retry interval’ will be running, meaning the Collector is likely monitoring the server at a one-minute interval (if the default value is unmodified). This means that once the Event Handler has been run, the Opsview Monitor server should detect that the service is now back ‘up’ and running, and thus the service check state should return to an ‘OK’ state (unless there is a problem stopping the service from restarting, such as misconfiguration, etc).
Event Handlers stages Copied
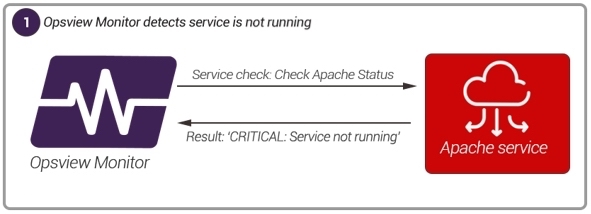
Service is not running
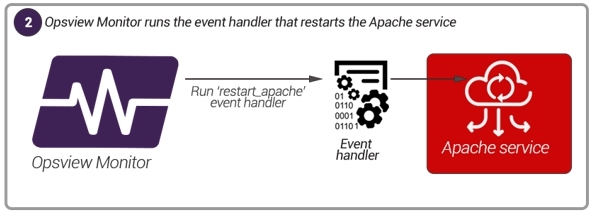
Restarts the Apache service
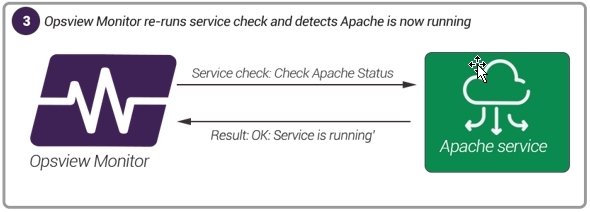
Apache is running
In the example above, we have chosen to run an Event Handler on the ‘Syslog service status’ service check, however, Event Handlers can be run on any host or service check; e.g. you may create an Event Handler that clears /tmp or ‘Recycle Bin’ when the ‘Disk capacity’ check changes to WARNING or CRITICAL. Alternatively, you may wish to create an Event Handler that flashes a series of lights red when a service check monitoring the number of ‘Severity 1 tickets’ changes from zero to one or more, in order to alert your support team quickly.
Creating a New Event Handler Copied
Event Handlers are scripts that can be written in any language executable by the host operating system (Perl, Python, or Bash).
Script location and permissions Copied
You will need root access to add a new event handler script.
Note
Event handler scripts are executed as theopsviewuser. If a custom event handler requires elevated permissions for some or all operations, you may need to add additional configuration on relevant systems (for example,/etc/sudoersrules).
Ensure that the event handler scripts are located in: /opt/opsview/monitoringscripts/eventhandlers/. It must have the correct owner (owned by ‘opsview:opsview’) and have file permissions of 0750:
root@system:/opt/opsview/monitoringscripts/eventhandlers# ls -alF
total 16
drwxr-x---  2 root    opsview 4096 Oct 21 08:24 ./
drwxr-x--- 13 root    opsview 4096 Sep  9 14:52 ../
-rwxr-x---  1 opsview opsview 151  Oct 21 08:24 rsyslog_restart*
-rwxr-x---  1 opsview opsview 151  Oct 21 08:22 windows_service_restart*
Environment Variables Copied
To get context on the event, certain Environment Variables are available to the script. Event Handlers should use the available macros within the environment to ensure that they only run when required. The main macros are:
$NAGIOS_HOSTSTATE (UP, DOWN or UNREACHABLE)
$NAGIOS_HOSTSTATETYPE (SOFT or HARD)
$NAGIOS_HOSTATTEMPT (number, starts from 1)
$NAGIOS_SERVICESTATE (OK, WARNING, CRITICAL or UNKNOWN)
$NAGIOS_SERVICESTATETYPE (SOFT or HARD)
$NAGIOS_SERVICEATTEMPT (number, starts from 1)
Other macros available within Opsview Monitor are:
$NAGIOS_CONTACTALIAS
$NAGIOS_CONTACTEMAIL
$NAGIOS_CONTACTGROUPLIST
$NAGIOS_CONTACTNAME
$NAGIOS_CONTACTPAGER
$NAGIOS_HOSTACKAUTHOR
$NAGIOS_HOSTACKCOMMENT
$NAGIOS_HOSTADDRESS
$NAGIOS_HOSTALIAS
$NAGIOS_HOSTDOWNTIME
$NAGIOS_HOSTDURATION
$NAGIOS_HOSTGROUPALIAS
$NAGIOS_HOSTGROUPNAME
$NAGIOS_HOSTNAME
$NAGIOS_HOSTNOTIFICATIONNUMBER
$NAGIOS_HOSTOUTPUT
$NAGIOS_HOSTPROBLEMID
$NAGIOS_HOSTSTATEID
$NAGIOS_LASTHOSTCHECK
$NAGIOS_LASTHOSTDOWN
$NAGIOS_LASTHOSTPROBLEMID
$NAGIOS_LASTHOSTSTATE
$NAGIOS_LASTHOSTSTATECHANGE
$NAGIOS_LASTHOSTUNREACHABLE
$NAGIOS_LASTHOSTUP
$NAGIOS_LASTSERVICECHECK
$NAGIOS_LASTSERVICECRITICAL
$NAGIOS_LASTSERVICEOK
$NAGIOS_LASTSERVICEPROBLEMID
$NAGIOS_LASTSERVICESTATE
$NAGIOS_LASTSERVICESTATECHANGE
$NAGIOS_LASTSERVICEWARNING
$NAGIOS_LASTSTATECHANGE
$NAGIOS_LONGDATETIME
$NAGIOS_LONGHOSTOUTPUT
$NAGIOS_LONGSERVICEOUTPUT
$NAGIOS_NOTIFICATIONAUTHOR
$NAGIOS_NOTIFICATIONCOMMENT
$NAGIOS_NOTIFICATIONNUMBER
$NAGIOS_NOTIFICATIONTYPE
$NAGIOS_SERVICEACKAUTHOR
$NAGIOS_SERVICEACKCOMMENT
$NAGIOS_SERVICEDESC
$NAGIOS_SERVICEDOWNTIME
$NAGIOS_SERVICEDURATION
$NAGIOS_SERVICENOTES
$NAGIOS_SERVICENOTIFICATIONNUMBER
$NAGIOS_SERVICEOUTPUT
$NAGIOS_SERVICEPROBLEMID
$NAGIOS_SERVICESTATEID
$NAGIOS_SHORTDATETIME
$NAGIOS_TIMET
In the example script below (/opt/opsview/monitoringscripts/eventhandlers/rsyslog_restart), we restart the Syslog service on the affected host, as per the scenario described above.
#!/bin/bash
# Uncomment below to get debug information about the environment variables set
# { date; echo "Called with: $*"; env | sort; echo; } >> /tmp/handler.log

# If Service State is CRITICAL (options are OK, WARNING, CRITICAL and UNKNOWN)
# and Service State Type is HARD (options are HARD and SOFT)
# then execute Event Handler action
set -e
if [[ "$NAGIOS_SERVICESTATE" = "CRITICAL" && "$NAGIOS_SERVICESTATETYPE" = "HARD" ]]; then
    echo "restarting syslog"
    # insert Event Handler action here...
    /opt/opsview/monitoringscripts/plugins/check_nrpe -H "$NAGIOS_HOSTADDRESS" -c eh_rsyslog_restart >/dev/null 2>&1
    # record event to syslog
    logger "Syslog restarted by Opsview $NAGIOS_HOSTADDRESS"
fi
The first part of this Event Handler will check the service state to ensure it is CRITICAL and also HARD (i.e. in case the service has temporarily stopped; this can be changed easily).
Once the Event Handler is satisfied the above criteria are met, it will echo restarting syslog and then run the command eh_rsyslog_restart on the host in question via nrpe (Infrastructure Agent), piping the output of the command to /dev/null (hiding the output). Finally, it will log that it has restarted the script.
Note
In this example it is assumed that the Infrastructure Agent running on the host has been configured to support theeh_rsyslog_restartand this command will run a script that will restart syslog (see Infrastructure Agent Configuration).
In the Opsview Monitor user interface, the Event Handler can be configured either on a global basis for the service check, for example, “if this service check changes to a CRITICAL state on any host, run this Event Handler”, or on an individual basis, “if this service check changes to a CRITICAL state on just this host”. This allows for bespoke Event Handlers that are customized for individual hosts.
Variables Copied
In addition to the Environment Variables described above, Opsview Variables can also be passed to event handlers. Much like Service Checks, the values of these variables will first look at the values stored on the host, if they exist, before defaulting to the global value for the variable.
For example, the following event handler definition would be filled out when set off by a service check/host to run the reset_jenkins script with the values of the JENKINS_AUTHENTICATION variable.
reset_jenkins -u %JENKINS_AUTHENTICATION:1% -p %JENKINS_AUTHENTICATION:2% -U %JENKINS_AUTHENTICATION:3%
It is important to note that sensitive information is often stored in these variables, so care should be taken to not pass these important values anywhere they’re not needed.
Applying an Event Handler to a Service Check Copied
This applies the event handler to all Hosts that use the modified service check.
Go to Configuration > Service Checks and edit the service check to which you want to apply the Event Handler. In our example it will be ‘Syslog active sessions’.
On the Service Check edit window, go to the ‘Details’ tab and click on the Advanced section:
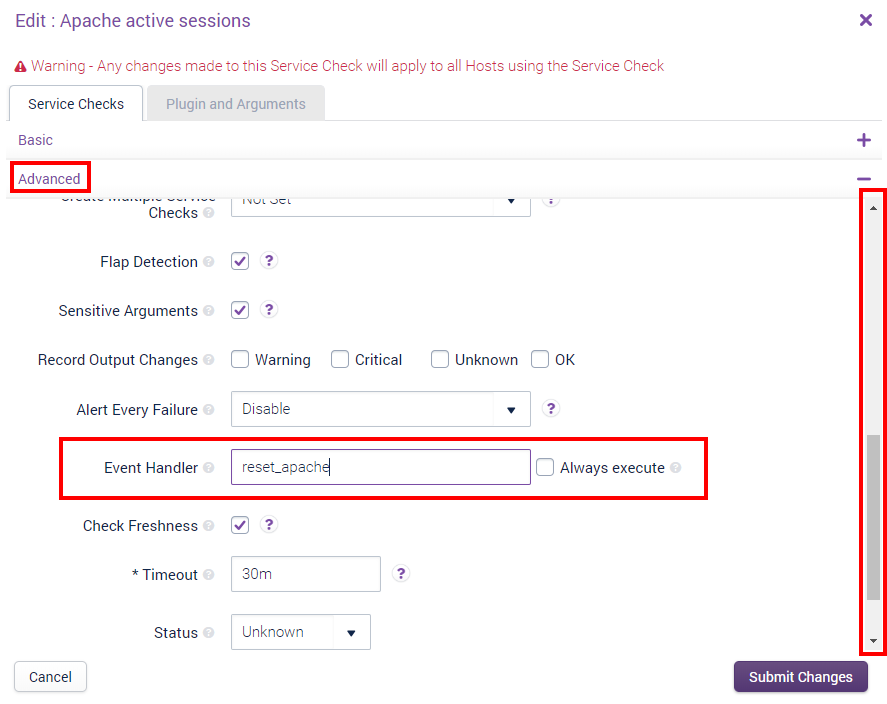
Once you have clicked ‘Submit Changes’, any host that has the ‘Syslog active sessions’ service check applied will have the Event Handler enabled for its service check.
Applying an Event Handler to a Host Copied
This applies the event handler to the one Host for which you modify the service check.
Go to Configuration > Hosts and edit the host to which you want to apply the Event Handler.
On the Host edit window, click on the Service Checks tab, and navigate to the service you want to add the Event Handler to using the tree panel on the left hand side.
Note
Ensure the service check is checked in the left hand panel; if the service check is not checked then the ‘Exceptions’ drawer will not be enabled.
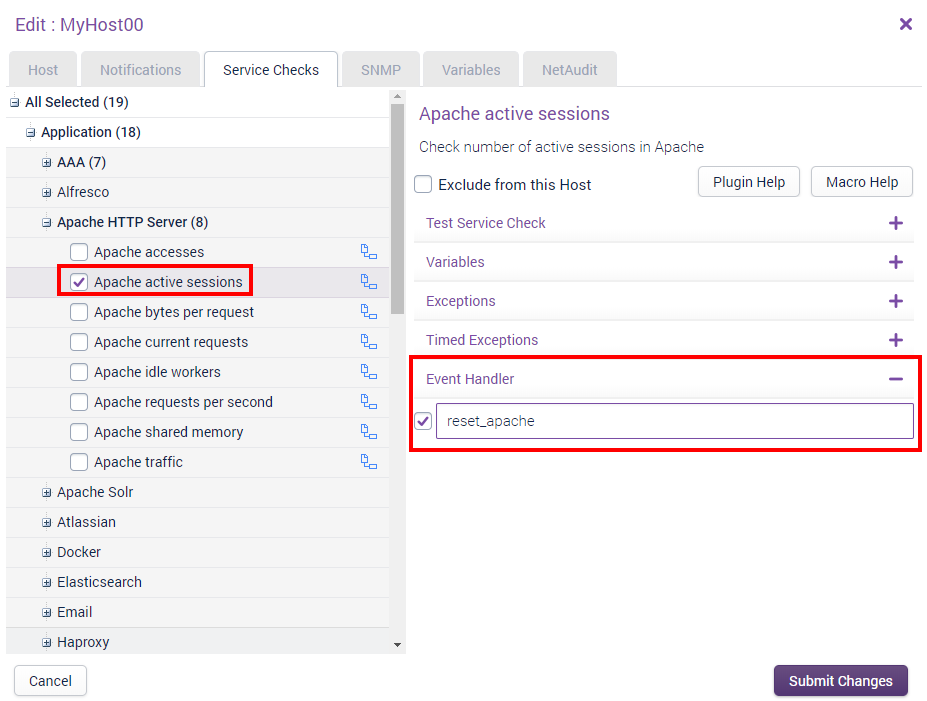
Once ‘within’ the service check, click on the ‘Exceptions’ drawer and check the ‘Event Handler’ checkbox as shown above.
Finally, enter the name of the Event Handler and click ‘submit changes’; this will now enable the ‘restart_syslog’ service check just for this service check on the host ‘Opsview’.
Debugging Event Handlers Copied
Here are a few helpful tips that can assist you in debugging Event Handlers that are not working.
Permissions Copied
Check that the permissions of the event handler are set correctly (as detailed above).
Testing during development Copied
You can test the Event Handler by manually passing the environment variables through to the script to simulate a check execution. This can be done using a command such as:
NAGIOS_SERVICESTATE=CRITICAL NAGIOS_SERVICESTATETYPE=HARD NAGIOS_SERVICEATTEMPT=3 /opt/opsview/monitoringscripts/eventhandlers/syslog_restart
Running this against our syslog_restart script, we can see the script execute successfully.
opsview@system:/opt/opsview/monitoringscripts/eventhandlers$
NAGIOS_SERVICESTATE=CRITICAL NAGIOS_SERVICESTATETYPE=HARD NAGIOS_SERVICEATTEMPT=3 /opt/opsview/monitoringscripts/eventhandlers/syslog_restart
restarting syslog
opsview@system:/opt/opsview/monitoringscripts/eventhandlers$
Checking the log Copied
If the script appears to be working when manually executed but is failing to run when an event triggers it, looking at the Opsview syslog is a good way to identify the cause of the issue. Switching the Executor component into debug mode will get it to log the individual executions of all scripts, including event handlers. See Component DEBUG logs.
The following log extracts are caused by common issues.
2019-10-21 09:55:50,781 ERR [opsview.executor.executorworker] Executor-2 Failed to execute JobRef=u'hid-5_sid-1129_oid-159' Error=[Errno 13] Permission denied: u'/opt/opsview/monitoringscripts/eventhandlers/syslog_restart'
As the log states, the permissions on the event handler script are incorrect. This means that the script is not executable by the Opsview user, either because the permission numbers are wrong or the owner/group of the file is not the opsview user. See the above Script location and permissions section.
2019-10-21 09:55:18,707 ERR [opsview.executor.executorworker] Executor-2 Failed to execute JobRef=u'hid-5_sid-1129_oid-159' Error=[Errno 2] No such file or directory: u'/opt/opsview/monitoringscripts/eventhandlers/syslog_restart'
Again as the log states, the event handler script is not in the expected location. This might be that the script has the wrong filename or that the event handler command specified in the UI is referring to the script by the wrong name.