Opsview 6.8.x End of Support
With the release of Opsview 6.11.0 on February 2025, versions 6.8.x have reached their End of Support (EOS) status, according to our Support policy. This means that versions 6.8.x will no longer receive code fixes or security updates.
The documentation for version 6.8.9 and earlier versions will remain accessible for the time being, but it will no longer be updated or receive backports. We strongly recommend upgrading to the latest version of Opsview to ensure continued support and access to the latest features and security enhancements.
SNMP Polling
What is SNMP Polling? Copied
SNMP Polling is a well-defined and well-understood method of monitoring within the IT monitoring industry. SNMP stands for Simple Network Management Protocol, and is a standard way of monitoring hardware and software from nearly every vendor on the planet; such as Cisco, VMware, Juniper, Microsoft, Linux operating systems and more.
There are two parts to SNMP ’ a Network Management Station (NMS) and a Management Agent (MA).The NMS, Opsview Monitor in this case, communicates with the management agent running on the hardware/software in question, using SNMP.
The management agent that runs on the hardware / software collects information about the aforementioned hardware/software and presents it in a logical fashion, allowing for it to be polled by the management station (Opsview Monitor).
This ’logical fashion’ uses two key concepts; OIDs (Object Identifier) and MIBs (Management Information Base). SNMP works by querying Objects, where an object is something containing data about a specific item within the hardware/software in question, i.e. temperature of a chip, etc. SNMP identifies Objects like this with an Object Identifier (OID).
OID’s are very structured and take a numbered, hierarchical tree structure. Most of the time, OID’s are translated into a more readable format, but you still might encounter situations where you will need to use the raw numbers - to find out more see SNMP Tutorial guide.
Tied closely to OID’s are the Management Information Bases or MIBs. A MIB is like a translator that helps your network management station (NMS) to understand the ’numbers’ within the OID. This means that instead of seeing ‘1.3.6.1.4.1.311: 44.03’ the MIB will translate and allows Opsview Monitor to display ‘CPU0 Temperature: 44.03’. In essence, the MIB makes SNMP objects usable.
MIB’s can be downloaded from the hardware/software vendor and loaded into Opsview Monitor by installing them into your distribution’s designated MIB directories.
Note
If you are using SNMP Traps, ensure that you copy your custom MIBs to ‘/opt/opsview/snmptraps/var/load’.
In the example below, the first group of text is missing a MIB file and is not able to fully translate the OID’s into a human-readable format (you can see the .94.1.1.4.1.4.4, for example.) The second group of text is able to fully translate the OID’s using a MIB.
SNMPv2-SMI::transmission.94.1.1.4.1.4.4 = Gauge32: 0 SNMPv2-SMI::transmission.94.1.1.5.1.1.4 = Gauge32: 0 SNMPv2-SMI::transmission.94.1.1.5.1.2.4 = Gauge32: 1151944 SNMPv2-SMI::transmission.94.1.1.5.1.3.4 = Gauge32: 0 SNMPv2-SMI::transmission.94.1.1.5.1.4.4 = Gauge32: 0 SNMP output without a MIB
MIB::adslAtucChanCrcBlockLength.4 = Gauge32: 0 byte ADSL-LINE-MIB::adslAturChanInterleaveDelay.4 = Gauge32: 0 milli-seconds ADSL-LINE-MIB::adslAturChanCurrTxRate.4 = Gauge32: 1151944 bps ADSL-LINE-MIB::adslAturChanPrevTxRate.4 = Gauge32: 0 bps ADSL-LINE-MIB::adslAturChanCrcBlockLength.4 = Gauge32: 0 SNMP output with a MIB
SNMP Security Copied
There are three versions of the SNMP protocol supported in Opsview Monitor:
- SNMP v1
- SNMP v2c
- SNMP v3
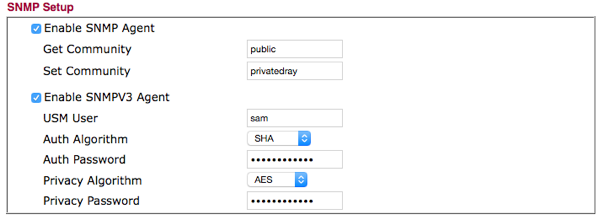
SNMP v1 and SNMP v2c are very similar in their configuration; an administrator configures a field known as the *community string *which is the authentication string (password, essentially) that the NMS needs to get the data from the MA (i.e. how Opsview Monitor can log in to the router to get the information about it).
SNMP v3 is more secure in that it allows an administrator to set a username, an authentication algorithm, an authentication password, a privacy algorithm AND a privacy password ’ all of which must be entered correctly within Opsview Monitor in order to allow access to the router/devices information.
In the screen below, both SNMP v1/v2c and v3 are configured:

These credentials must be entered into Opsview Monitor in order to allow the monitoring of the Host in question.
Configuring a Host for SNMP Polling Copied
To configure a Host so that Opsview Monitor is able to poll it for information, you should configure the ‘SNMP’ tab within the Host edit modal window. This is covered within detail within Section Configuring a host: ‘SNMP’ tab. Note that the ‘aes256’ and ‘aes256c’ SNMPv3 privacy protocol options are only fully supported on some operating systems (see SNMP Privacy Protocol Support).
Configuring a New SNMP Polling Check Copied
To configure a new SNMP polling check, go to Configuration > Service Checks.
Once within the Service Checks window, click on the ‘Add New’ button in the top left and then click on SNMP Polling.

Once ‘SNMP Polling’ has been clicked, a window similar to the one below will load:

Details Tab: Basic Copied
The Details tab is split into two drawers, ‘Basic’ and ‘Advanced’.
The items within ‘Basic’ are the most commonly used fields for Service Check configuration:
- Name: The name of the service check, i.e. ‘Cisco 3750 Stack configuration status’.
- Description: A friendly description of the Service Check, i.e. ‘A custom SNMP check that returns the status of the switch in the context of its stack configuration. Apply this to all stacked Cisco 3750’s.’
- Service group: Covered in Section Service Group, a Service Group is a container for one or more Service Checks and are used for alerting and access control, amongst others.
- Host templates: Covered in Section, a Host template can contain one or more Service Checks from any Service Group. While a Service Check can only ever belong to one Service Group, it can belong to as many Host templates as you desire.
- Check period: Covered in Section Overview - an introduction to Time Periods, the check period defines when the Service Check runs. Generally, this is set to ‘inherit from host’, meaning if the Host is set to be monitored between 9:00 am and 5:00 pm, then the Service Check will also only run between 9:00 am and 5:00 pm.
- Check interval: The interval between Service Check execution, i.e. if set to 5m the Service Check will run every 5m; if set to 30s the Service Check will run every 30 seconds.
Details Tab: Advanced Copied
The items within ‘Advanced’ are the less used, more ‘advanced’ Service Check options:
- Hashtags: The hashtags which this Service Check will belong to, when applied to one or more hosts.
- Globally applied hashtags: If the Service Check has been added to a Hashtag via the ‘Configuration > Hashtags’ section instead of the selection box above, then the Hashtags will be listed here. To remove the Service Check from the Hashtag listed here, you should edit the Hashtag within ‘Configuration > Hashtags’.
- Dependencies: Dependencies allow you to set a parent/child relationship for the Service Check, i.e. for this SNMP polling check, we may choose to have a parent Service Check of ‘TCP Port 161’. This means that if the Service Check ‘TCP Port 161’ changes to a critical state (i.e. SNMP is DOWN), then this Service Check and all other Service Checks that are a child of the aforementioned service check will change to an UNREACHABLE state and will not recheck until the parent Service Check returns to an ‘OK’ state. This not only reduces the work load of the Opsview Monitor server but also reduces alerts; Opsview Monitor will only alert for the ‘TCP Port 161’ failure and not for all of its dependent children.
- Maximum check attempts: This field determines the number of times a Service Check has to fail for the Service Check to change into a ‘hard state’. In Opsview Monitor 5.0 there is the concept of ‘soft’ and ‘hard’ states. When a Service Check fails and the Service Check changes into the ‘CRITICAL’ state it is considered a ‘soft’ state. After the Service Check has failed for the number of times specified in this field is considered a ‘hard’ state, i.e. not a temporary blip, etc. You can use hard states so that you are only notified when a Service Check is truly CRITICAL. The interval used here is not the ‘check interval’ but the ‘Retry interval’.
- Retry interval: A separate field to the ‘Check interval’, the ‘Retry interval’ is only used when a Service Check goes into a ‘CRITICAL’ / ‘WARNING’ / ‘UNKNOWN’ state. For a Service Check to go from a ‘soft’ state to a ‘hard’ state, the Service Check must fail $X number of times, where $X is the value set in this field. For example, if the Retry Interval is 1m and the Max Check Attempts is set to three, the Service Check will run once a minute for three minutes ’ after which if the Service Check is still ‘CRITICAL’ it will change from a ‘soft DOWN’ to a ‘hard DOWN’.
- Notify for service on This section determines which states the Service Check should notify on, i.e. only on ‘CRITICAL’ or ‘UNKNOWN’, for example.
Note
If a Host does not notify on any states, then the Service Checks on that Host will also not send any Notifications.
- Notification period: This field uses the ‘Time Periods’ already defined within the Opsview Monitor system, and determines when Notifications are allowed to be sent to Users.
- Re-notification interval: This field determines the period of time (in hours, minutes or seconds) after which a Notification is re-sent if the Host is still unhandled (i.e. the problem has not been ACKNOWLEDGED). If this is set to ‘0’, only the first Notification is sent (when the Host changes to the ‘HARD’ state).
- Create Multiple Services: If a Variable is selected within this drop-down, for each Variable of the selected type added a new Service Check will be added with the value in the Variable added to the Service Check name. I.e. if we have ‘Disk Capacity’ as a Service Check with ‘%DISK%’ selected in the ‘Create Multiple Services: drop down’, then if four Variables are added via the ‘Variables’ tab ’ 4 Service Checks will be added ‘Disk Capacity: Value1, Disk Capacity: Value2’, and so forth.
- Flap Detection: A service is considered flapping if its state changes too much. If this option is set, any services will be checked for this flapping condition and an icon will appear for the service and Notifications will be temporarily disabled until the service comes out of a flapping state.
- We recommend that flap detection is enabled for active checks. However if you find a service is flapping frequently, there is probably another issue that needs investigating.
- We recommend that flap detection is disabled for passive checks.
- Sensitive arguments: If the Service Check is a plugin-based one, then the Sensitive Arguments checkbox allow you to determine if the arguments for the Service Check are displayed within the ‘Test Service Check’ tab within the investigate mode. If the flag is checked, the arguments will be hidden ’ if unchecked the arguments will be shown. If a User has TESTCHANGE set within their Role, you will be able to modify the arguments before testing the Service Check.
- Record Output Changes: Normally, the output of a Service Check is only recorded when the state of that service changes. For example, assuming a new check has been set up:
| State | Output | Output Recorded |
|---|---|---|
| OK | Service OK: 10% | Yes |
| OK | Service OK: 15% | No |
| OK | Service OK: 15% | No |
| OK | Service OK: 20% | No |
| CRITICAL | Service warning: 80% | Yes |
| CRITICAL | Service warning: 75% | No |
| WARNING | Service warning: 70% | Yes |
| WARNING | Service warning: 40% | No |
| WARNING | Service warning: 40% | No |
| OK | Service OK: 20% | Yes |
| OK | Service OK: 18% | No |
This option instead causes every change of output to be logged regardless of change of state (for the selected state changes). For example, for the same sequence above with OK and WARNING selected:
| State | Output | Output Recorded |
|---|---|---|
| OK | Service OK: 10% | Yes |
| OK | Service OK: 15% | Yes |
| OK | Service OK: 15% | No |
| OK | Service OK: 20% | Yes |
| CRITICAL | Service warning: 80% | Yes |
| CRITICAL | Service warning: 75% | NO - CRITICAL option was not selected |
| WARNING | Service warning: 70% | Yes |
| WARNING | Service warning: 40% | Yes |
| WARNING | Service warning: 40% | No |
| OK | Service OK: 20% | Yes |
| OK | Service OK: 18% | Yes |
- Alert every failure: This option forces a Notification to be sent on every check in a non-OK state. This is useful if you have a passive Service Check which receives results. There are three states for this option:
- Disabled: only get alerts on state changes
- Enabled: get alerts for every failed state. This overrides the re-notification interval option
- Enabled with re-notification interval: get alerts for every failed state as long as the re
- Notification interval has passed. This is useful if you get a lot of results in quick succession
Note
The Notification number will increase for every non-OK result and only gets reset to zero when an OK state is received.
- Event handler: Covered in greater detail in the ‘Event handler’ section of the User Guide, Event Handlers are scripts that can be triggered when a Service Check goes into a ‘CRITICAL’, ‘WARNING’ or ‘UNKNOWN’ state (soft/hard, depending on the event handler script). The script can do anything you like, but a common usage includes restarting a service or server (virtual machine, for example) via an API.
SNMP Polling Tab Copied
When configuring an SNMP Polling service check, it is possible to run an SNMP Walk against a host so that you have the complete list of all OIDs on the host.
The main user journey to create a new SNMP Polling Service Check is:
- On an example host, run the SNMP walk to see what data is available
- Choose the OID to monitor
- Modify the calculate rate and label as required
- Add the warning/critical thresholds
- Then save this and assign to hosts
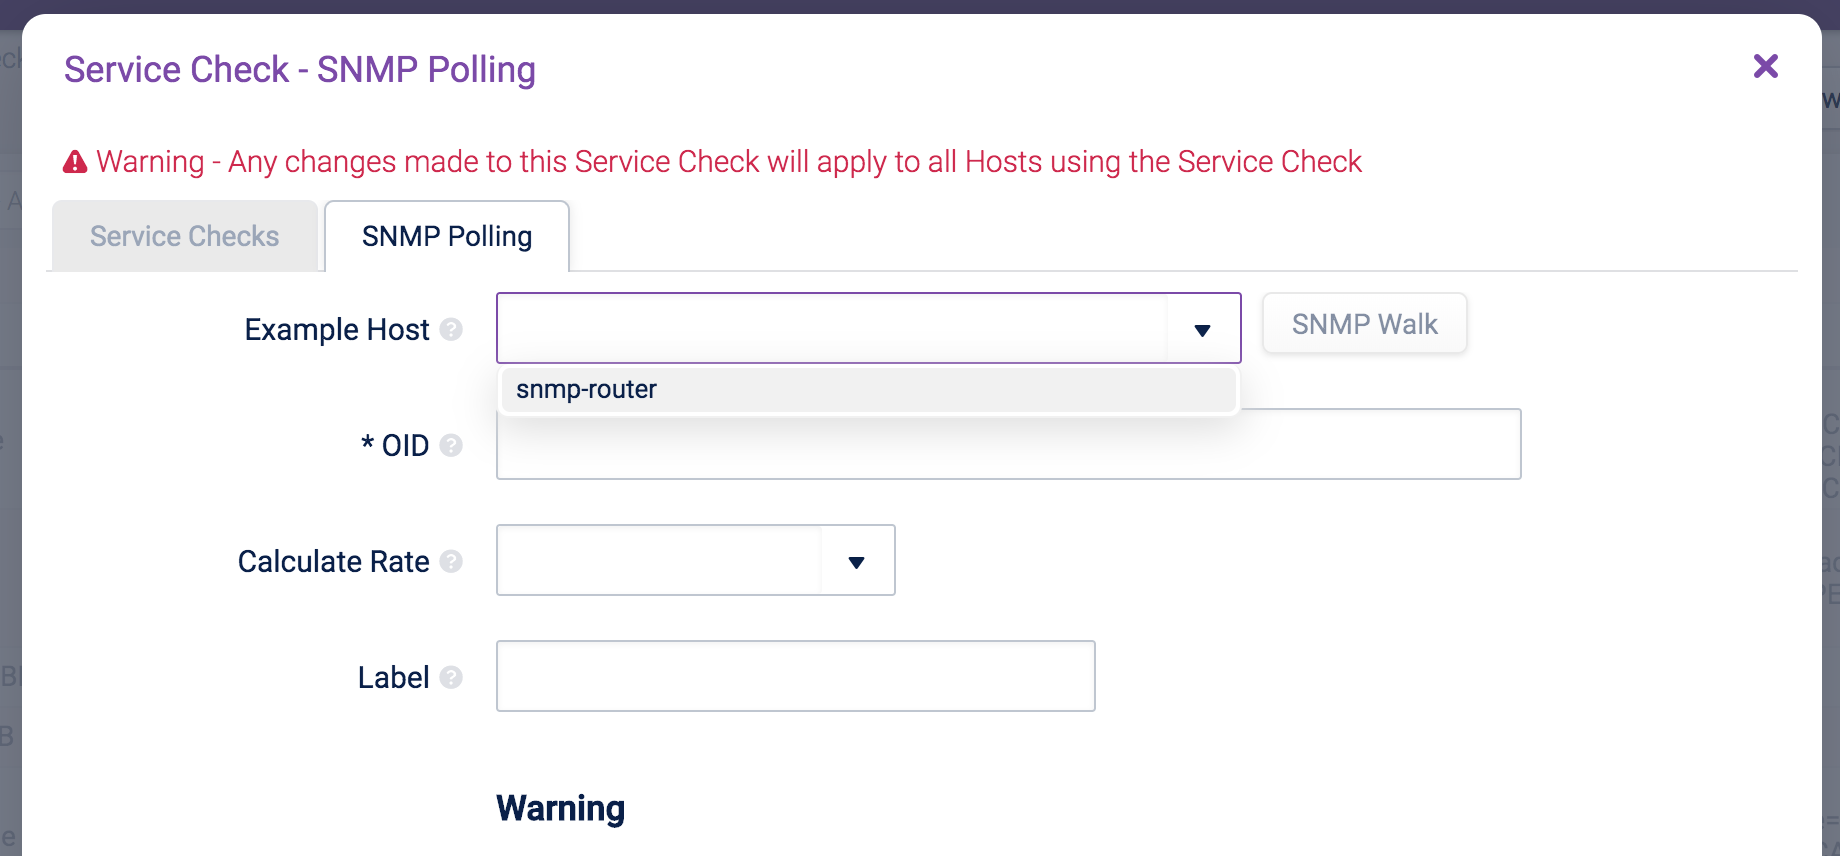
Example Host Copied
The configuration tab will show an Example Host field:

Note
As SNMP Walks can take a long time, Opsview Monitor will cache previous results in its database. Users can click Rescan to force another SNMP Walk to run and get the latest SNMP Walk.
If there are some OIDs that are expected to be present but are not, the SNMP agent on your host may need to be configured.
There is a timeout of 30 minutes for the SNMP Walk to complete. users can alter this timeout by editing the value in opsview_web_local.yml.
Fields:
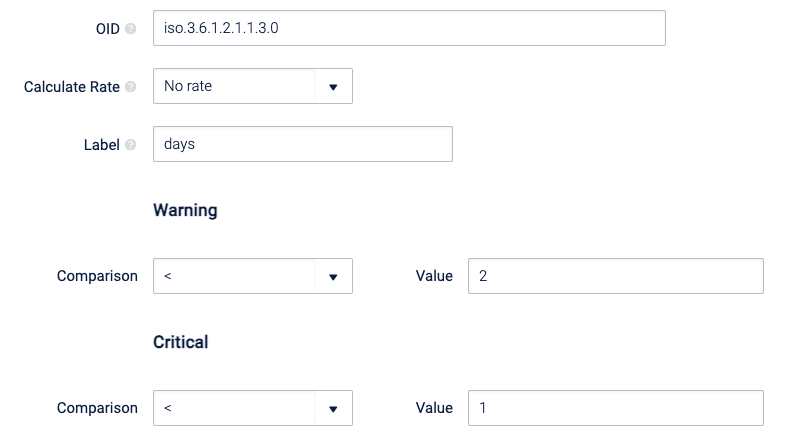
- OID: Uniquely identify managed objects in the MIB that will be retrieved. See your device documentation for what OIDs are available.
- Calculate Rate: If desired, you can calculate the rate change of the value of the OID. This is only useful for values, counters or gauges.
- Label: This is the label for the value of the OID, which is used for saving to the performance database.

Add the calculations using the Warning/Critical sections, i.e. if we are monitoring a temperature, set the warning field to ‘>’ for the numeric comparison and the value to ‘40’, and the same for critical but with a higher value. This means, if the temperature goes above 40, set the Service Check to warning, if it goes above X set it to critical.
Modify the label, calculation rate and the warning/critical values as required:

Click Submit Changes and the new Service Check is created! See Section Service Checks Tab for guides on how to add the newly-created Service Check to a Host.
SNMP Polling Process Copied
In Opsview 6.0, the pysnmp and pysmi Python libraries are used to translate OIDs. Note: The package snmp-mibs-downloader needs to be installed on Debian and Ubuntu to be able to fully translate the most common (and publicly available) OIDs.
The pysnmp library creates compiled versions of MIBs installed on the system and caches them in the directory /opt/opsview/var/pysnmp. The Orchestrator can be configured for additional MIB installation locations by creating an orchestrator.yaml file which contains the dictionary key snmp_mib_dirs which lists all the mibs directories, as below:
    snmp_mib_dirs:
        - /opt/opsview/var/snmp
        - /path/to/your/mibs/dir
The valid OIDs syntax is:
- iso.3.2.1.6 (shortcut)
- 1.3.2.1.6 (shortcut)
- SNMPv2::sysdescr.0 (translated)
Any other type of data passed will raise an exception of invalid OID exception.