Opsview 6.8.x End of Support
With the release of Opsview 6.11.0 on February 2025, versions 6.8.x have reached their End of Support (EOS) status, according to our Support policy. This means that versions 6.8.x will no longer receive code fixes or security updates.
The documentation for version 6.8.9 and earlier versions will remain accessible for the time being, but it will no longer be updated or receive backports. We strongly recommend upgrading to the latest version of Opsview to ensure continued support and access to the latest features and security enhancements.
Filtering
The Audit Log grid can be filtered either by using the Search box at the top of the table or by using the menus available via the column headers.
In the example below, I have searched for the word ‘starting’. When the ‘search icon’ or ‘ENTER’ button is pressed, the ‘Activity Description’ column will be filtered for Audit Log entries that contain the given string ‘starting’, as below:

As you can see, the ‘Activity Description’ column is now highlighted purple to represent that a filter has been applied. To clear the filter, simply remove the entered text.
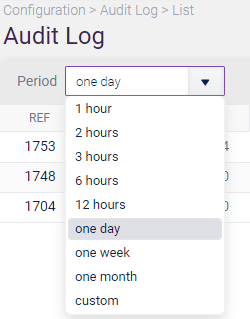
To filter on the date range, use the ‘Period’ field:

You can filter by a specific duration or set a custom date and time range.
You can also filter on the User column. These filters may be cleared by clicking the red X joined to the filter:

Note, that this is a string search, so substrings will match. However, SYSTEM is a special username (for internally generated events), which will only match if it is exactly the same.
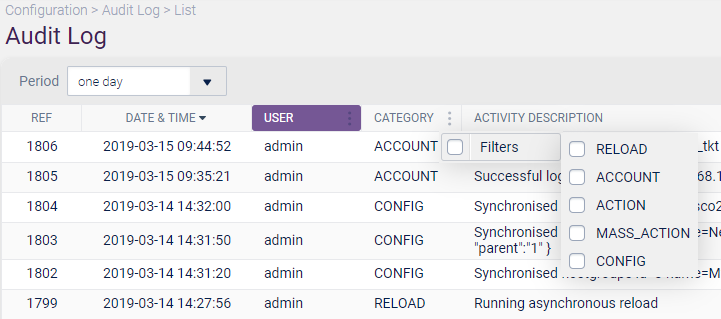
Filtering within categories can be achieved via the checkboxes available within the contextual menu, as below:

In the above screenshot, there are 5 categories available. These are:
- RELOAD — apply changes from within the Configuration menu of Opsview Monitor.
- ACCOUNT — a log in or log out event.
- ACTION — an action change made to the system. Eg: downtime, acknowledgements, set states, notes.
- MASS_ACTION — a mass action event. A single entry will be shown here, with multiple ACTION events for each object.
- CONFIG — a configuration change in Opsview that requires the Apply Changes from within the Configuration menu (example, host change is CONFIG, a notes change is ACTION). This is used to work out the number of changes to show in Apply Changes page.