Opsview 6.8.x End of Support
With the release of Opsview 6.11.0 on February 2025, versions 6.8.x have reached their End of Support (EOS) status, according to our Support policy. This means that versions 6.8.x will no longer receive code fixes or security updates.
The documentation for version 6.8.9 and earlier versions will remain accessible for the time being, but it will no longer be updated or receive backports. We strongly recommend upgrading to the latest version of Opsview to ensure continued support and access to the latest features and security enhancements.
Host - Investigate Mode
The Investigate mode is available within the contextual menu of Hosts and Service Checks that provides you with the ability to investigate every aspect of a Host or Service Check within a dedicated modal window.
To load up the investigate window, click the ‘Investigate’ option from within a Host’s contextual menu.
In the investigate mode for a Host, the following tabs are available:
- Info
- Actions
- Notes
- Notifications
- History
- Host Interfaces
- Events
Info tab Copied
The ‘Info’ tab is displayed when the Investigate mode window first opens:
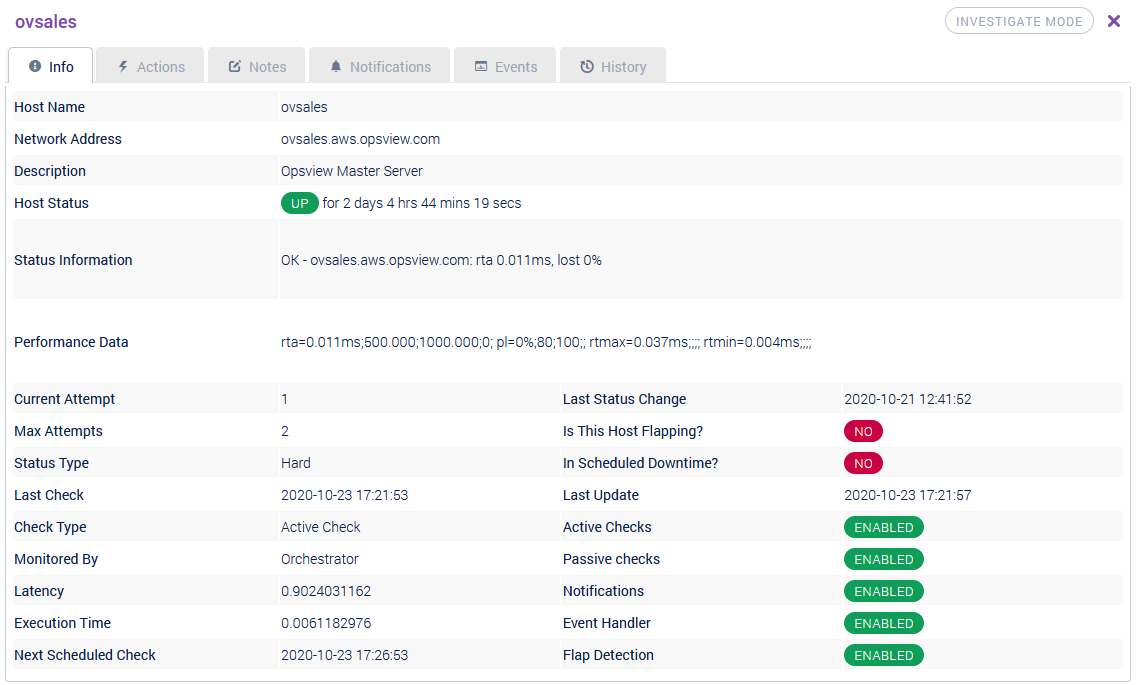
The Info tab is a one-stop shop for all information relating to the Host. For an explanation of what each field means, see below:
- Host Name: This is the unique identifier for this host
- Network Address: This is the address to use when communicating to the host. This is usually an IP address or a DNS name
- Description: This is a short description of the host
- Host Status: The state of the Host, i.e. ‘UP’, ‘DOWN’ or ‘UNREACHABLE’. Also displays how long the Host has been in the given state, i.e. ‘UP for 2 days’. If a host has been acknowledged, this will also show here
- Status information: The output of the Host Check Command. In the example above, ‘ping’ is used as the Host Check Command, therefore the RTA of the ping is returned.
- Performance data: If the Host Check Command returns data in a ‘performance data’ (‘perfdata’) format, it will be displayed here. This will be automatically parsed and inserted into the time series database
- Current Attempt: The current check attempt number. This number will be between one and the number defined in the ‘Max Attempts’ field.
- Max Attempts: The number of attempts required for the Host to be converted from a ‘SOFT’ state to a ‘HARD’ state.
- State Type: This is either Hard or Soft. The Host will be in a ‘SOFT’ state until the number of Max Attempts has been met, at which point it will convert from SOFT to HARD.
- Last Check: The date and time of the last check of the Host, i.e. the last time the Host Check Command was run.
- Check Type: Active/Passive, depending on your configuration.
- Monitored By: The name of the Monitoring Cluster that is responsible for monitoring the Host.
- Latency: The time in seconds it took Opsview Monitor to execute the Host Check Command from the time that it should have executed it.
- Execution Time: The time in seconds it took Opsview Monitor to get a response from the Host via its Host Check Command.
- Next Scheduled Check: The date and time expected for the next scheduled Host Check Command. This could be “Unknown” if this is a passive check
- Last State Change: The date and time of the last state change, e.g. when the Host last changed between ‘UP’, ‘DOWN’ or ‘UNREACHABLE’.
- Is This Host Flapping?: Either ‘Yes’ or ‘No’ label relating to Flap Detection, which is configured within the ‘Notifications’ tab of the edit window for the Host. See Section Configuring a Host: ‘Notifications tab’ for more information. If the Host is considered to be ‘flapping’, this field will change to ‘Yes’.
- In Scheduled Downtime?: A ‘Yes’ or ‘No’ label relating to whether the Service Check is in a state of downtime or not. If the Service Check is in an active period of downtime (i.e. the current date and time falls within a downtime periods configured date and time), the label will read ‘Yes’ and a “dialogue” icon will display the comment and expire time for the Downtime
- Last Update: The date and time of when a Host Check Command result was received for this Host.
- Active Checks: An ‘Enabled’ or ‘Disabled’ label relating to whether active checks are currently allowed for this Host. This is configured via the ‘Actions’ tab. For more information, see Section ‘Investigate mode: Host ’ Actions tab’.
- Passive Checks: Currently, this is always ‘Enabled’, as host results are always available to be received.
- Notifications: An ‘Enabled’ or ‘Disabled’ label relating to whether Notifications are currently enabled or disabled for this Host. This is configured via the ‘Actions’ tab. For more information, see Section ‘Investigate mode: Host ’ Actions tab’.
- Event Handler: An ‘Enabled’ or ‘Disabled’ label relating to whether an event handler is currently allowed for this Host. This is configured via the ‘Actions’ tab. For more information, see Section ‘Investigate mode: Host ’ Actions tab’.
- Flap Detection: An ‘Enabled’ or ‘Disabled’ label relating to whether Flap Detection is currently enabled or disabled on this Host. This is configured via the ‘Actions’ tab. For more information, see Section ‘Investigate mode: Host ’ Actions tab’.
The data on this tab is refreshed each time you open the Investigate mode or when you go to another tab and come back to the Info tab.
Acknowledgements Copied
When an Acknowledgement has been set on a Host, it will be shown next to the Host Status as well as a “dialogue” icon displaying the comment for the Acknowledgement:
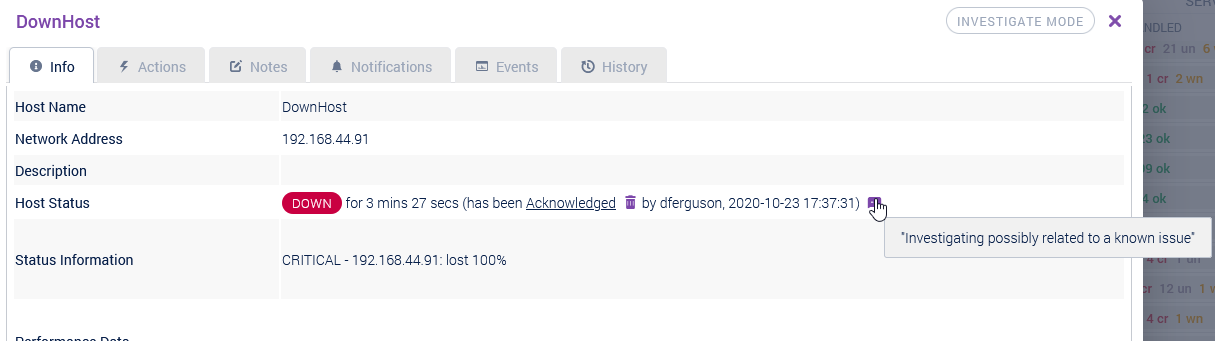
You can remove the Acknowledgement by clicking on the underlined text where you will be prompted to confirm removal. After confirming, you will see a drop-down notification in the top right-hand corner of the screen to indicate the Acknowledgement has been removed.
Actions tab Copied
The ‘Actions’ tab allows you to make changes related to this host:
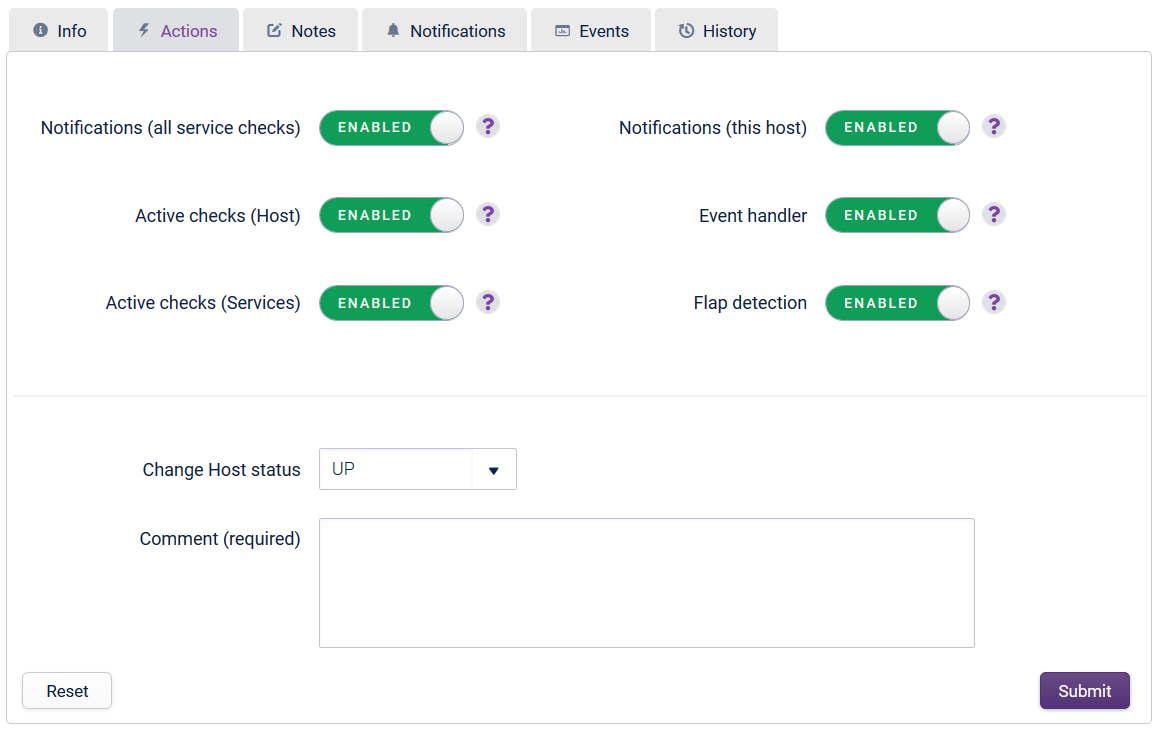
The Actions tab provides you with the ability to toggle certain settings relating to the Host such as whether Active Checks are enabled for the Host, or whether Flap Detection is enabled.
All the toggle switches are actioned immediately, meaning if ‘Event handler’ is toggled from ‘Enabled’ to ‘Disabled’, the Host no longer executes Event Handlers immediately, without the need for a ‘Commit’ button to be pressed.
The second half of the tab allows for the submission of a Passive Check result for the Host Check Command, i.e. change the Host from an ‘UP’ to a ‘DOWN’ state with a user defined ‘output’.
Clicking the ‘Reset’ button will clear all values entered into the ‘Submit Passive Check’ boxes. Clicking ‘Submit’ will submit the passive check result.
Notes tab Copied
The ‘Notes’ tab allows you to add any information regarding this host:
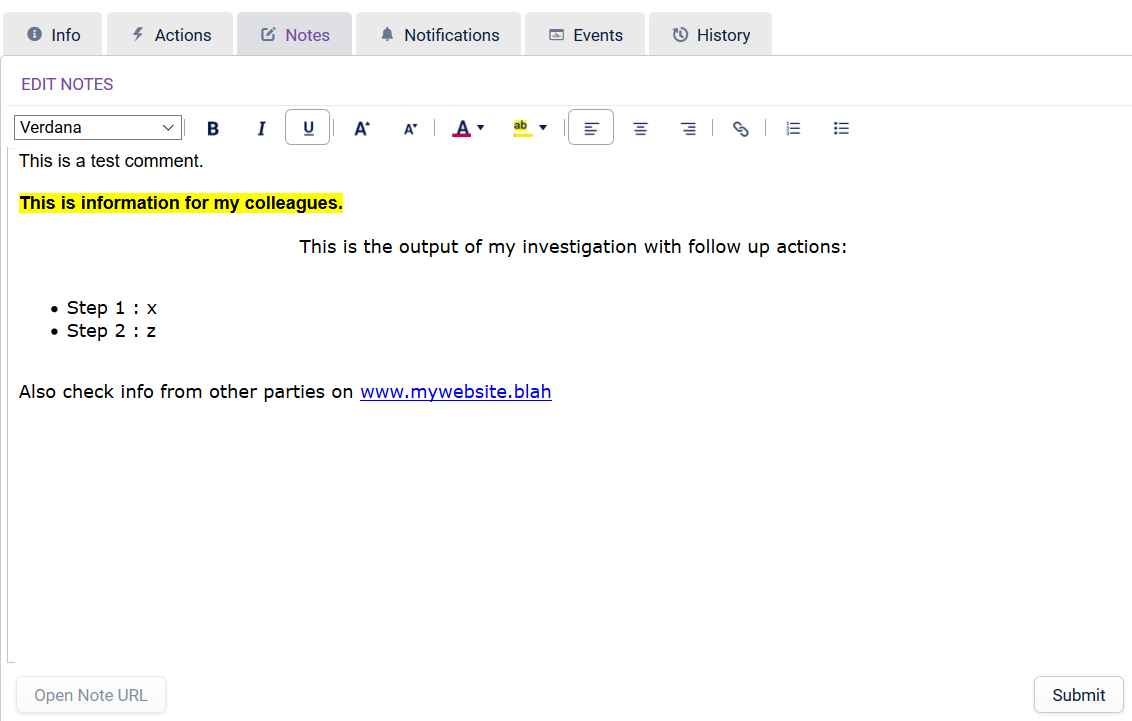
The Notes section for a Host is very similar to the one for Host Groups, in that it allows you to enter text in a WYSIWYG editor which can be seen by other Users of Opsview Monitor (who have permission to view the relevant Host). This is a great way to leave notes about what the Host is i.e. This is Tims Tyres router, they are located in London, UK and have an internal subnet of 192.168.1.0/24 with the router's IP being 1.254....
To have edit permissions, you must have change abilities for this host.
The Open Note URL button is enabled if you have configured the Host Info URL in Configuration > My System > Options Tab.
To see these notes within the database, they are kept within the opsview databases hostinfo table.
- for hostgroup and servicecheck notes these are also shown within the respective opsview tables of hostgroupinfo and serviceinfo
Notifications tab Copied
The Notifications tab allows you to see all the notifications sent for this host:
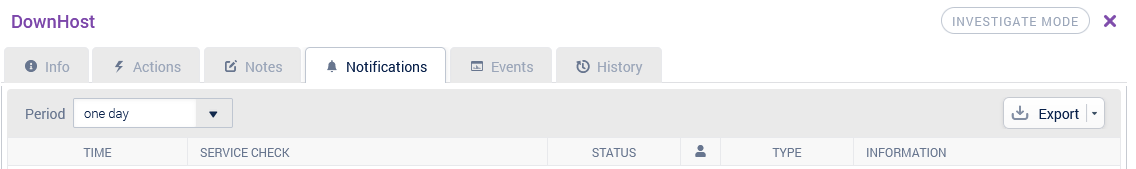
This tab will show all Notifications sent relating to either the Host or one of the Hosts Service Checks.
- Time: The date and time the Notification was sent.
- Service Check: If relating to a Service Check, the Service Check name will be listed here. This field will be blank if the Notification is sent due to an issue with the Host Check Command.
- Status: The status of the Service Check or Host Check at the point of the Notification; i.e. CRITICAL, DOWN, etc
- “Buddy” icon : This is the number of Users who the specific Notification was sent to.
- Type: This is the type of notification. Possible values are: Normal, Acknowledgement, Flapping Start, Flapping Stop, Flapping Disabled
- Information: The output of the Service Check or Host Check at the point of the Notification.
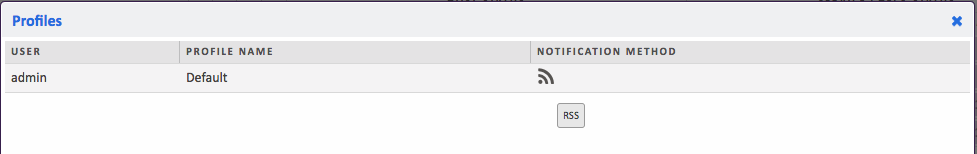
The number in the Number of Users column is clickable, at which point a new modal window will appear displaying the username, profile name and Notification Methods used to notify the Users. These notification methods are displayed as icons, which have a description in the tooltip when the mouse is hovered over the icon:
The list of Notifications can be exported by clicking on the ‘Export’ button, at which point you are prompted to choose one of three export formats: csv, json and xml. When the format is selected, the Notifications list will be generated in the given format and downloaded to your desktop/device via the browser.
History tab Copied
The History tab allows you to see historical events that occurred for this host:
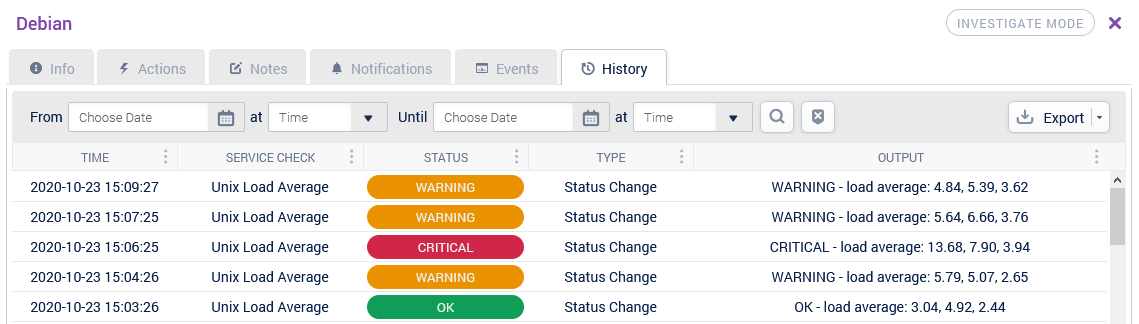
The default view is to show the last day’s worth of events.
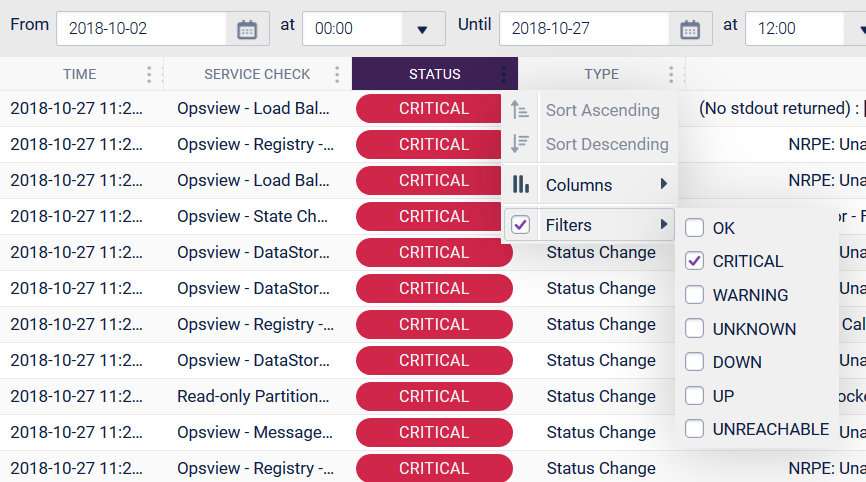
To filter on the date and time, you can use the filter toolbar at the top of the table. Enter the date and times for From and To and click on the ‘search’ icon. To clear the entered results and reset the values in the fields you should click on the ‘cross’ icon.
This tab will show the history of the Host and all of its Service Checks within a tabular format. The ‘State’ and ‘Type’ columns can be filtered via the columns contextual menu as below:
For State Change events, the first SOFT state change (eg: check attempt 1 of a max attempts 4) will be recorded, and then when it goes into a HARD state (eg: check attempt 4 of max attempts 4). All the intermediate states (eg: 2 of 4, and 3 of 4) are not recorded.
Downtime Start events will be recorded when the object goes into downtime for the first time. If there is a second downtime assigned to the object (eg: an overlapping downtime), the start will not be recorded.
Downtime End events will be recorded when the object comes out of downtime for the last time. If there is a downtime that finishes but another downtime is in progress, the end will not be recorded.
Acknowledgement events will be recorded at the time of the acknowledgement, with the acknowledgement comment.
The history list can be exported by clicking on the ‘Export’ button, at which point you are prompted to choose one of three export formats: csv, json and xml. When the format is selected, the History list will be generated in the given format and downloaded to your desktop/device via the browser.
Host Interfaces tab Copied
This tab is only listed if there are interfaces associated with the host. The ‘Host Interfaces’ tab allows you to see which SNMP interfaces are configured for monitoring (see Configuring a Host: ‘SNMP’ tab for configuration information).
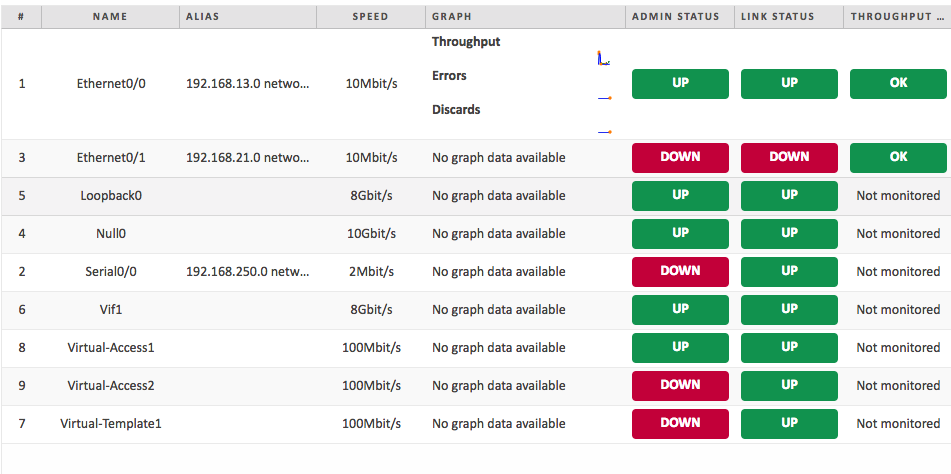
Host Interfaces provided a single overview of the performance and status of each monitored interface on the specific Host, including the speed, graph (sparkline graph of the throughput, errors and discards), admin status, link status and the monitored state.
Events tab Copied
The Events tab allows you to see the historical events for this host, in a bar chart format:
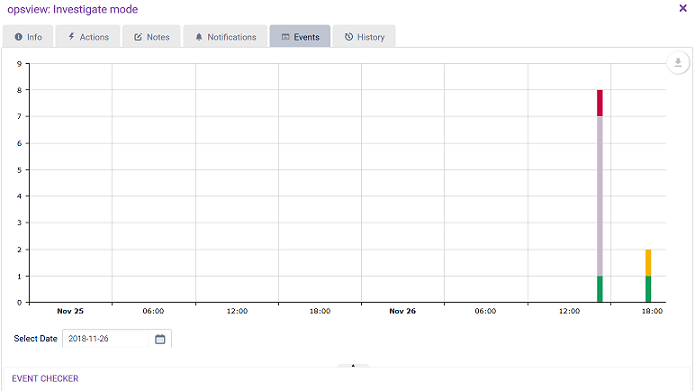
Essentially a different way of analyzing the History of a Host and its Service Checks, the Events tab allows Users to choose a date using the date picker on the left-hand side, which then re-populates the bar graph with the events (if any) for that chosen date. In the screen above, we have 32 ‘OK’ events around 11:00.
By default, the bar graph is displayed ‘full tab’, with the Event Checker minimized. The mouse can be hovered over the bars which will reveal the number of events in that given state, i.e. 33 ‘CRITICAL’ events in the example below. When one or more bars are clicked, the Event Checker will be populated with the events from the selected bars.
To clear the Event Checker and minimize it we can re-click on the ‘CRITICAL’ bar, it will be deselected. When no bars are selected, the Event Checker will automatically minimize.
Within the event chart, located in the top right, is a ‘downwards’ arrow. When hovered-over, this arrow will reveal contextual menu options:
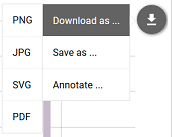
- Download as: allows you to download the graph in one of four formats: png, jpg, svg or pdf.
- Save as: allows you to export the data into .csv, .xlsx or .json
- Annotate: allows you to put some notes before downloading as an image. When doing so, the download button transforms into a ‘pencil’ to allow for further annotation options.