Opsview 6.8.x End of Support
With the release of Opsview 6.11.0 on February 2025, versions 6.8.x have reached their End of Support (EOS) status, according to our Support policy. This means that versions 6.8.x will no longer receive code fixes or security updates.
The documentation for version 6.8.9 and earlier versions will remain accessible for the time being, but it will no longer be updated or receive backports. We strongly recommend upgrading to the latest version of Opsview to ensure continued support and access to the latest features and security enhancements.
Active Checks and Monitoring plugins
Overview Copied
Active Checks are performed by Monitoring Plugins and are the most common and popular way of monitoring hosts.
Monitoring plugins can be written in any language, from bash and C to Perl and Python. For a detailed look at writing Monitoring Plugins, see Monitoring Plugins Development Guidelines.
In essence, a monitoring plugin is a translator that resides between Opsview Monitor and the item we wish to monitor. The plugin speaks both languages; It knows how to speak to Opsview in Opsview Monitor’s language, and it knows how to talk to the Host in the Host’s language:
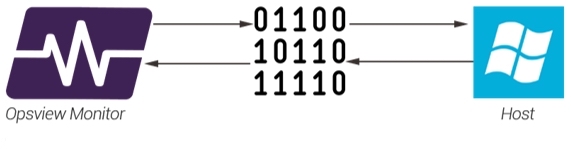
For example, If Opsview Monitor wants to talk to a Windows Host it will need to know how to ’talk Windows’. This is where a plugin comes in. Opsview Monitor simply asks the question, ‘Hey, go and find out how full the C: drive is’. The Plugin goes to the Windows Host, asks the question, gets the answer, and converts it into a format that Opsview Monitor understands and can process for alerts, graphs and more.
Most monitoring plugins require input in order to run. For example the Windows C: service check above will likely require the username and password to authenticate, but also the name of the drive that needs to be monitored. These pieces of information are known as arguments. Arguments provide the plugin with the information required to run correctly. Each plugin generally comes with a help file, visible within Opsview Monitor via ‘Show plugin help’, which explains what options are needed, what options are available, and how to set them.
Common options, also known as ‘flags’, are:
- -H: After this flag, enter the Host address, e.g. ‘-H 192.168.0.1’ to run the plugin against 192.168.0.1.
- -w: The warning flag. If monitoring a number, e.g. a temperature, the warning flag is followed by a number that is exceeded will result in the service check changing to a WARNING status. e.g. ‘-w 55’ means if the temperature is above 55, then set to WARNING (unless the temperature exceeds the CRITICAL level, as set below, then the Service Check will change to a CRITICAL state).
- -c: The critical flag. The number immediately following this option tells Opsview to change the state of the Service Check to CRITICAL if the value is above this number, e.g. ‘-c 75’..
A plugin-based service check comprises two component parts:
<plugin> <arguments>
For example, the Service Check below returns the number of users connected to an Oracle database:
check_oracle_health --connect=$HOSTADDRESS$ --user=%ORACREDENTIALS:1% --password=%ORACREDENTIALS:2% --name=system --mode=connected-users
‘check_oracle_health’ is the plugin, and the remainder of the line are the arguments needed by the plugin in order to successfully log in and retrieve the number of users. (Items wrapped in $ symbols are known as Macros, and items wrapped in % symbols are known as Variables.
Plugins directory Copied
Plugins live on the master server (or cluster which are managed by the master). They live within the folder /opt/opsview/monitoringscripts/plugins/ and must be owned by opsview:opsview and have the file permissions 0750, as below:
-rwxr-x---1 opsview opsview Aug 14 11:03 check_solr
If the permissions and ownership is not set correctly, the plugin may not execute or may return errors ’ depending on the plugin.
Status Codes Copied
All plugins return a status code. This status code is what Opsview Monitor uses to determine the state of the service check.
Status code ‘0’ means that the Service Check is running successfully and without errors, thus ‘OK’:
$  check_icmp -H 192.168.0.1 -w 100.0,20% -c 500.0,60%Output: OK - 192.168.0.1 : rta 0.287ms, lost 0%|rta=0.287ms;100.000;500.000;0; pl=0%;20;60;; rtmax=0.453ms;;;; rtmin=0.242ms;;;;
Errors:
Return code: 0
Status code ‘1’ means that the Service Check is in a warning state, as shown below:
$ check_http 'H 192.168.0.1 -w 5 -c 10
Output: HTTP WARNING: HTTP/1.1 401 Unauthorized - 192 bytes in 0.017 second response time |time=0.017094s;5.000000;10.000000;0.000000 size=192B;;;0
Errors: Return code: 1
Status code ‘2’ means that the Service Check is in a critical state, as shown below:
$  check_nrpe -H 192.168.0.1 -c check_load -a '-w 5,5,5 -c 9,9,9'
Output: Connection refused by host
Errors: Return code: 2
Status code ‘3’ means that the Service Check in an ‘UNKNOWN’ state. This may indicate that the Service Check is mis-configured or that there is an issue with the monitored Host:
$ check_apache_performance 'H 192.168.0.1 -m bytes_per_request -t 60
Output: APACHE STATUS UNKNOWN - 404 Not Found
Errors: Return code: 3
Performance Data Most plugins return what is known as *performance data. *This data is listed in after the pipe symbol, ‘|’, and is picked up by Opsview Monitor and stored for graphing purposes.
$ check_icmp -H 192.168.0.1 -w 100.0,20% -c 500.0,60%
Output: OK - 192.168.0.1 : rta 0.287ms, lost 0% | rta=0.287ms;100.000;500.000;0; pl=0%;20;60;; rtmax=0.453ms;;;; rtmin=0.242ms;;;; Errors:
Return code: 0
The performance data returned is extracted by Opsview Monitor and can be found in the Performance Data field within the ‘investigate mode’ for the Service Check (covered later in this section):
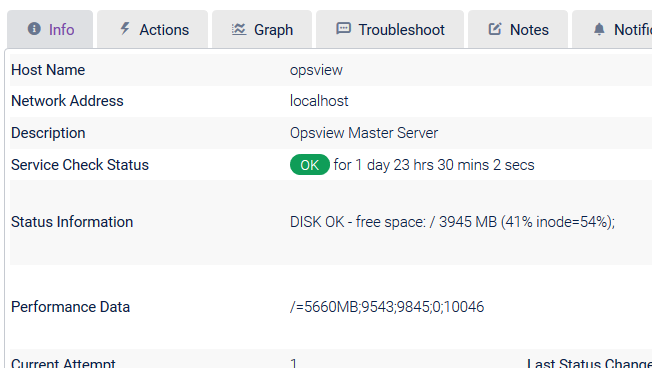
If there is no performance data present, the ‘Graph’ tab will be hidden (as there is no data to plot on the graph).
Administering Plugins in Opsview Monitor Copied
Warning
Log4j vulnerabilities
If importing custom Java-based plugins, we recommend ensuring that any version of Log4j used is >= 2.17.1, to mitigate vulnerabilities:
Importing a plugin Copied
Warning
Only import plugins from trusted sources. Importing untrusted and unverified scripts could compromise your system’s integrity.
Monitoring plugins are stored within /opt/opsview/monitoringscripts/plugins/ on Opsview Collector servers. There are two ways in which you can add a new plugin to Opsview Monitor.
The plugin must start with check_ to be successfully imported.
User interface Copied
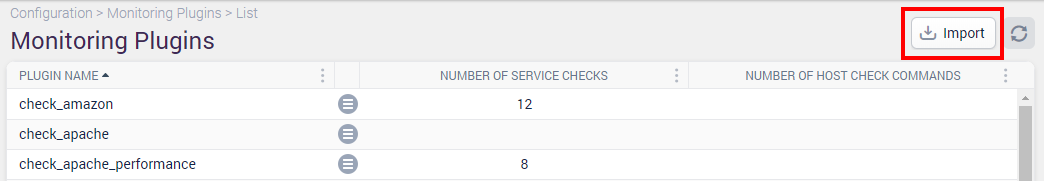
A monitoring plugin can be imported from the Monitoring Plugins page within the Opsview Monitor user interface, this can be found via ‘Configuration > Monitoring Plugins’
Once loaded, you will be presented with a view similar to the one below, listing all of your currently installed Monitoring Plugins. To import a Monitoring Plugin, click on the Import button:
At this point you may get an error if imports have not been enabled by your Opsview Administrator:
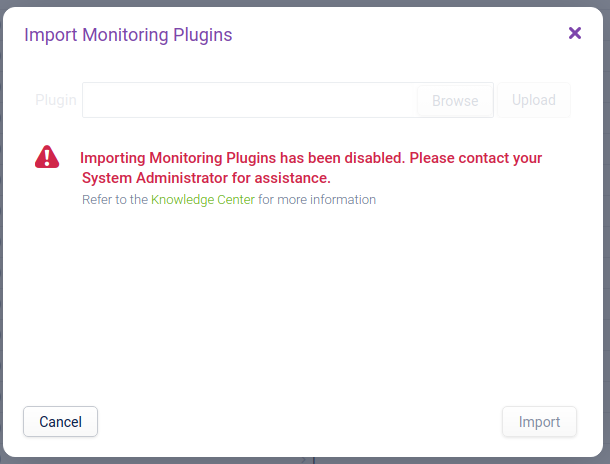
Note
Import Monitoring Plugin" functionality has been disabled by default on new installations.
You can still import Monitoring Plugins or Opspacks via the command line. Please contact your System Administrator for assistance.
To enable this feature, set the following variable in /opt/opsview/deploy/etc/user_vars.yml:
opsview_allow_plugin_upload: True
This will then be kept upon upgrade.
To push out this change to your system, you must run the orchestrator-install.yml playbook, however if you wish to not run this playbook at this time you may add the change into the /opt/opsview/webapp/opsview_web_local.yml file and then restart your opsview-web component.
Controller::Settings:
  allow_plugin_upload: True


/opt/opsview/watchdog/bin/opsview-monit restart opsview-web
If you only make this change and not the user_vars.yml edition, the change will be lost upon upgrade.
- note: you may already have a “Controller::Settings section, so this will only need to be added to this
The import window will look like this:
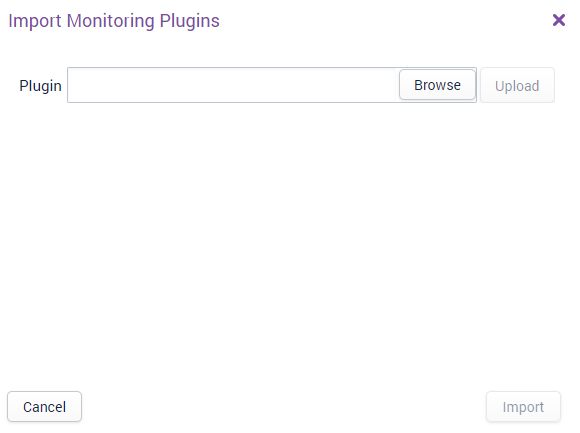
Click Browse and select the file you wish to import (e.g. check_apache) and press Upload.
Note
The loader will show successful uploads, errors or files that already exist which can be overwritten.
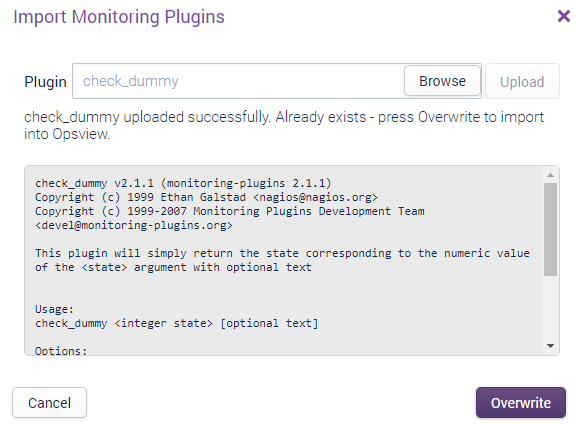
Press Import or Overwrite (the button text changes depending on the action to take).
From there you will be able to see your new Plugin in the Monitoring Plugins list page.
Command Line Copied
The second way in which you can upload your Monitoring Plugin is via the command line. It is simply a case of copying the plugin to the /opt/opsview/monitoringscripts/plugins/ folder and setting the appropriate permissions.
For example, to copy it from Mac/Linux
to the Opsview Master you should run the following command using SCP (Note: if you do not know the opsview user password, transfer the file as a different user and then copy into place):
$ scp new_plugin.pl opsview@opsview.monitor:/opt/opsview/monitoringscripts/plugins/
Once the plugin is successfully copied, SSH to the server and navigate to the plugin directory. Once within the directory, set the ownership and file permissions respectively:
$ chown opsview:opsview check_plugin.pl
$ chmod 750 check_plugin.pl
Finally, change to the ‘opsview’ user and attempt to run the plugin (all plugins should accept the ‘-h’ option for printing help output):
# su - opsview
$ /opt/opsview/monitoringscripts/plugins/check_plugin.pl -h
If the plugin execution fails, please ensure that the permissions are set appropriately, as above, and read the error message for any potential dependencies that need to be installed, e.g. SDKs or pre-requisite packages.
Copying plugins from a Windows desktop to Opsview Monitor is very similar, however you must use WinSCP or a similar application instead.
Removing a plugin Copied
This page will show you how to remove a Plugin you no longer need. This can be done on the Monitoring Plugins page.
How to remove Copied
On the Plugin you wish to remove select the contextual menu icon.
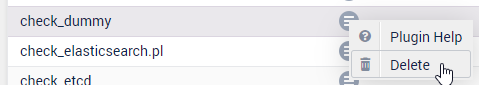
Select the Delete* option.
Accept the confirmation.
The Plugin will then be removed from the system.
Configuring a new plugin-based Service Check Copied
To configure a new plugin-based Service Check, go to the Configuration > Service Checks menu.
Once within the Service Checks window, click on the ‘Add New’ button in the top level and then click on Plugin Check.
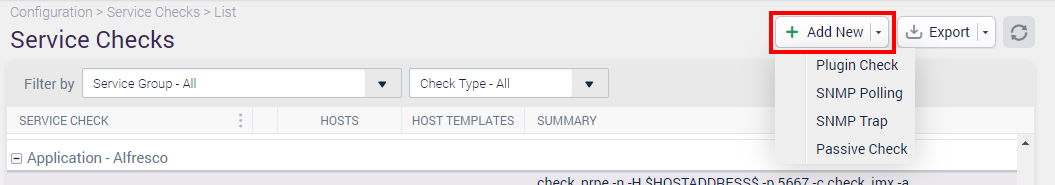
This will cause the following window to load:
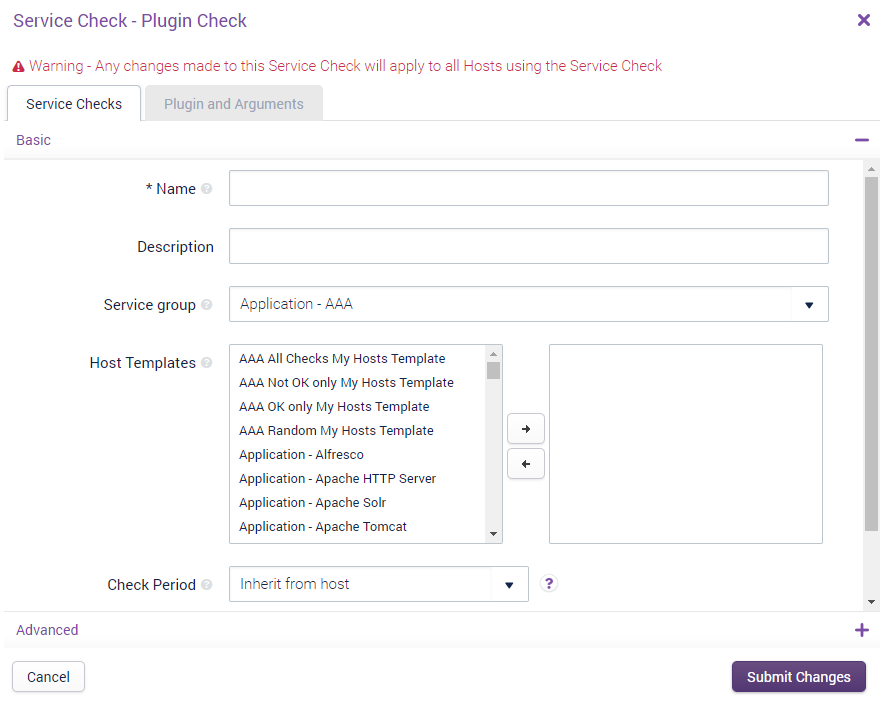
The window is split into two tabs:
- Details: This is where you can configure various Service Check-related fields, such as the name, description, its Service Group, and its Host Templates.
- Plugin and Arguments: The plugin-specific tab, which is where the plugin is selected and the arguments for the plugin are entered.
Details Tab: Advanced Copied
Hashtags Copied
The Hashtags to which this Service Check will belong, when applied to one or more Hosts.
Globally applied hashtags Copied
If the Service Check has been added to a Hashtag via the ‘Settings > Hashtags’ section instead of the selection box above, then the hashtags will be listed here. To remove the Service Check from the Hashtag listed here, you should edit the hashtag within ‘Settings > Hashtags’.
Dependencies Copied
Dependencies allow you to set a parent/child relationship for the Service Check, e.g. for a check that runs via the Opsview Agent, we may choose to have a dependency of a check which simply checks the agent is available. This will mean we only get one alert if the agent on a Host isn’t running, not one alert for each check that runs via that agent.
You can set more than one dependency per service check. In this case, if any one of dependencies is in a alert state, the child Service Check will trigger the “Dependency failure: xxx” status.
Maximum check attempts Copied
This field determines the number of times a Service Check has to fail for the Service Check to change into a ‘hard state’. In Opsview Monitor there is the concept of ‘soft’ and ‘hard’ states. When a Service Check fails and the Service Check changes into a failure it is initially considered a ‘soft’ failure. After the Service Check has failed for the number of times specified in this field is considered a ‘hard’ failure, i.e. not a temporary ‘blip’. You can use hard states so that you are only notified when a Service Check is truly failing.
Retry interval Copied
A separate field to the ‘Check interval’, the ‘Retry interval’ is only used when a Service Check goes into a ‘CRITICAL’ / ‘WARNING’ / ‘UNKNOWN’ state. For a Service Check to go from a ‘soft’ state to a ‘hard’ state, the Service Check must fail X times, where X is the value set in this field. For example, if the Retry Interval is 1 (minute) and Max Check Attempts is set to 3, the service check will run once a minute for three minutes, after which if the Service Check is still ‘CRITICAL’ it will change from a ‘soft DOWN’ to a ‘hard DOWN’.
Notify for service on Copied
This section determines which states the Service Check should notify on, i.e. only on ‘CRITICAL’ or ‘UNKNOWN’, for example. **Note: **If a Host does not notify on any states, then the Service Checks on that Host will also not send any Notifications.
Notification period Copied
This field uses the ‘Time Periods’ already defined within the Opsview Monitor system, and determines when Notifications are allowed to be sent to users.
Create Multiple Services Copied
If a Variable is selected within this drop-down, for each Variable of the selected type added a new Service Check will be added with the value in the Variable added to the Service Check name. I.e. if we have ‘Disk Capacity’ as a Service Check with ‘%DISK%’ selected in the ‘Create Multiple Services: drop-down’, then if four Variables are added via the ‘Variables’ tab ’ four Service Checks will be added ‘Disk Capacity: Value1, Disk Capacity: Value2’, and so forth.
Flap Detection Copied
A service is considered flapping if its state changes too much. If this option is set, any services will be checked for this flapping condition and an icon will appear for the service and notifications will be temporarily disabled until the service comes out of a flapping state. We recommend that flap detection is enabled for active checks. However if you find a service is flapping frequently, there is probably another issue that needs investigating. We recommend that flap detection is disabled for passive checks.
Sensitive arguments Copied
If the Service Check is a plugin-based one, then the Sensitive Arguments checkbox allow you to determine if the arguments for the Service Check are displayed within the ‘Test Service Check’ tab within the investigate mode. If the flag is checked, the arguments will be hidden ’ if unchecked the arguments will be shown. If you have TESTCHANGE set within your Role, you will be able to modify the arguments before testing the service check.
Record Output Changes Copied
Normally, the output of a Service Check is only recorded when the state of that service changes. For example, assuming a new check has been set up:
| State | Output | Output Recorded |
|---|---|---|
| OK | Service OK: 10% | Yes |
| OK | Service OK: 15% | No |
| OK | Service OK: 15% | No |
| OK | Service OK: 20% | No |
| CRITICAL | Service warning: 80% | Yes |
| CRITICAL | Service warning: 75% | NO |
| WARNING | Service warning: 70% | Yes |
| WARNING | Service warning: 40% | No |
| WARNING | Service warning: 40% | No |
| OK | Service OK: 20% | Yes |
| OK | Service OK: 18% | No |
This option instead causes every change of output to be logged regardless of change of state (for the selected state changes). For example, for the same sequence above with OK and WARNING selected:
| State | Output | Output Recorded |
|---|---|---|
| OK | Service OK: 10% | Yes |
| OK | Service OK: 15% | Yes |
| OK | Service OK: 15% | No |
| OK | Service OK: 20% | Yes |
| CRITICAL | Service warning: 80% | Yes |
| CRITICAL | Service warning: 75% | NO - CRITICAL option was not selected |
| WARNING | Service warning: 70% | Yes |
| WARNING | Service warning: 40% | Yes |
| WARNING | Service warning: 40% | No |
| OK | Service OK: 20% | Yes |
| OK | Service OK: 18% | Yes |
Alert every failure Copied
This option forces a Notification to be sent on every check in a non-OK state. This is useful if you have a passive Service Check which receives results.
There are three states for this option:
- Disabled: only get alerts on state changes
- Enabled: get alerts for every failed state. This overrides the re-notification interval option
Event handler Copied
Covered in greater detail in the Event Handlers section of the User Guide, Event Handlers are scripts that can be triggered when a Service Check goes into or returns from a problem state, such as CRITICAL or WARNING. The script can do anything you like, but a common usage includes restarting a service or server (virtual machine) via an API.
Always execute Copied
If the Always execute check box is ticked, then every result received for this service will cause the event handler to be executed. This is useful for passive checks if you need to process all results that arrive, such as matching 3 CRITICAL results with 3 subsequent OK results. If this is unticked, the event handler will be executed only when a state change occurs.
Check Freshness Copied
The Check Freshness is added to the Check Interval period. If the Check Interval was set to 5 minutes and the Check Freshness set to 1 minute then the service check would go Stale on the 6th minute if a results wasn’t received at the 5 minute mark.
Plugin and Arguments Tab Copied
Once you have configured the relevant options within the Details tab, you can click on the Plugin and Arguments tab. The two Help buttons will open extra windows containing either the plugin help output or macro help details:
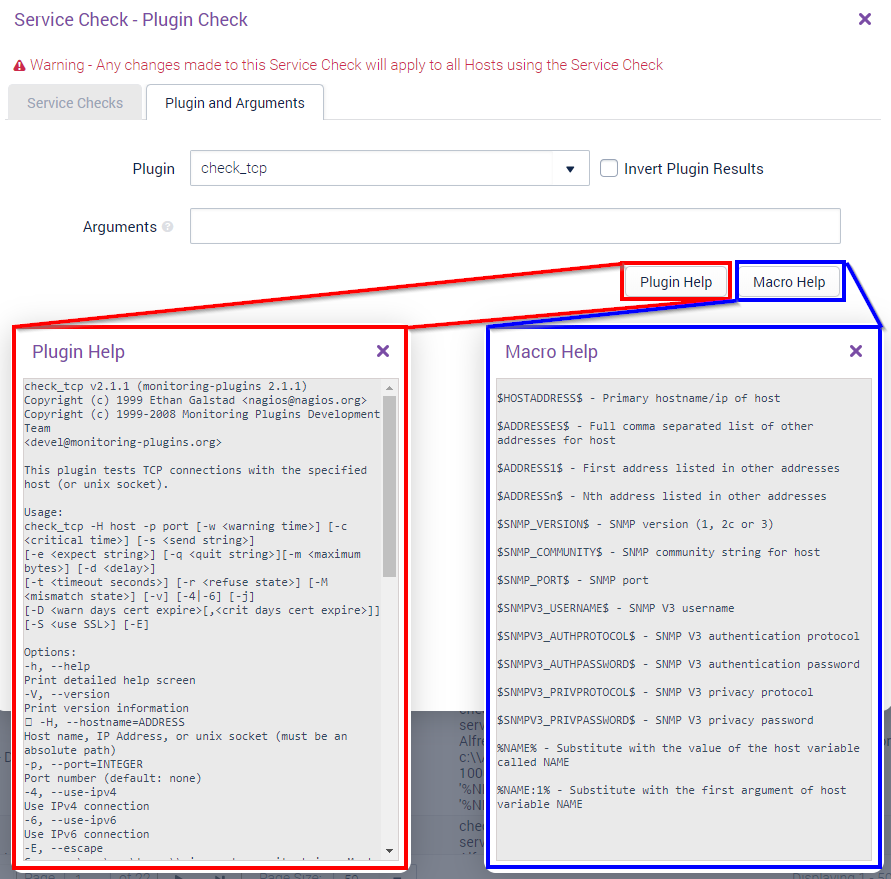
The main User steps for the plugin-based Service Checks is:
- Select a plugin from the drop-down
- View the ‘Plugin Help’
- Enter the relevant arguments
- Submit changes
Invert Plugin Results is a checkbox that when checked will invert certain result codes from a plugin, i.e. a critical result can be inverted to OK and vice versa.
Note
If the plugin is not listed in the ‘Plugin:’ dropdown, the ensure that the permissions are set correctly and that the plugin starts with ‘check_’. Any script in libexec that does not start with ‘check_..’ will not be listed.
Once the Service Check and its options have been configured, it can be applied to one or more Hosts. See Section Service Checks Tab for guides on how to add the newly-created Service Check to a Host.