Opsview 6.8.x End of Support
With the release of Opsview 6.11.0 on February 2025, versions 6.8.x have reached their End of Support (EOS) status, according to our Support policy. This means that versions 6.8.x will no longer receive code fixes or security updates.
The documentation for version 6.8.9 and earlier versions will remain accessible for the time being, but it will no longer be updated or receive backports. We strongly recommend upgrading to the latest version of Opsview to ensure continued support and access to the latest features and security enhancements.
System Overview
Overview Copied
In Configuration > My System go to the System Overview tab:
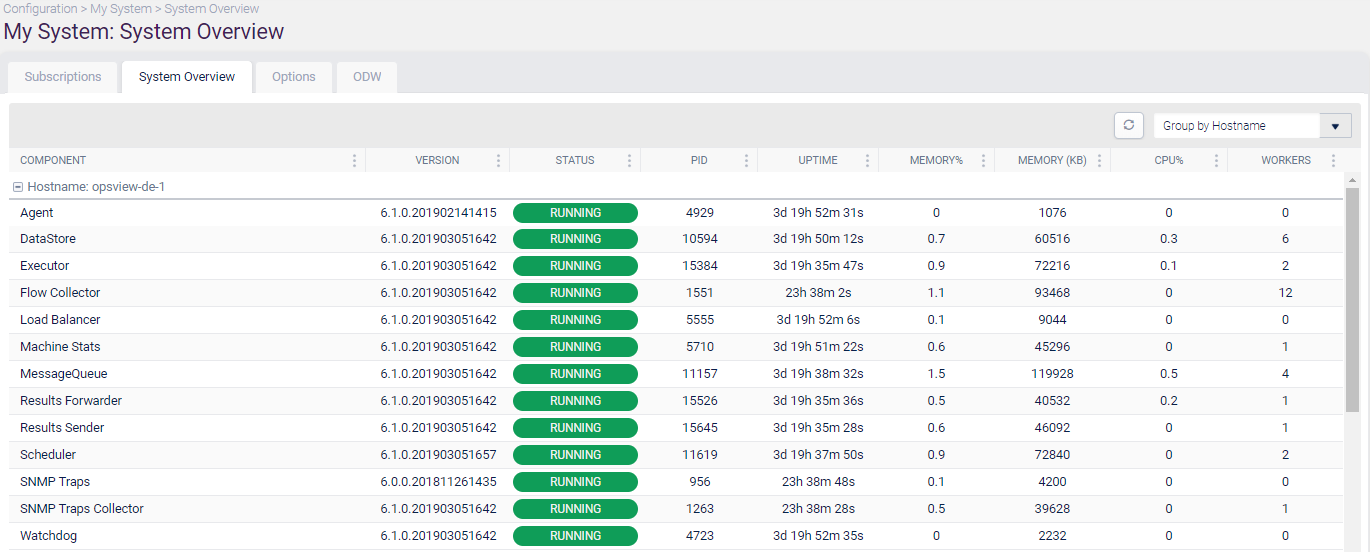
The System Overview tab contains a list of all the components used by Opsview, across all the hosts that the work is spread over. This allows you to see in a single table all the parts that make up Opsview.
You can group components by the component name (and see which hosts they are running on) or by host (so you can see which components are running on a host). The default is to group by host.
Each component can be repeated multiple times, once for each host.
This grid will automatically refresh after 60 seconds.
If there are any components missing, there will be a grid at the top with a list of the missing components.
Table Columns Copied
Note
Some fields will not be populated unless the component is running. The values are taken at a point in time, at 1 minute intervals.
Hostname Copied
This is the name of the host.
Component Copied
This is the component name.
Version Copied
This is the version of the component. This may be useful for diagnosis.
Note
As components are built individually, they may not all have the same version number.
Status Copied
There are four possible states for each component:
- Running – this is running correctly
- Error – there was an error in trying to execute this component. Escalate to Customer Success if this persists
- Not Monitored – this component has been disabled from Watchdog. The component should be re-enabled as soon as possible. Ask your System Administrator to start them.
- Pending – the component is in a transitional state, such as initializing. If this persists, escalate to Customer Success
PID Copied
This is the Process ID on the host that the component is running on.
Uptime Copied
This is the length of time that the component has been running.
Memory% Copied
This is the amount of memory used by the component on the host it resides on.
Memory (kb) Copied
This is the total amount of memory used by the component in kilobytes.
CPU% Copied
This is the percent of CPU time used by the component on the host it resides on.
Workers Copied
This is the number of worker threads that the component uses.