Component diagram
The following diagram gives an overview of the OP5 Monitor architecture.
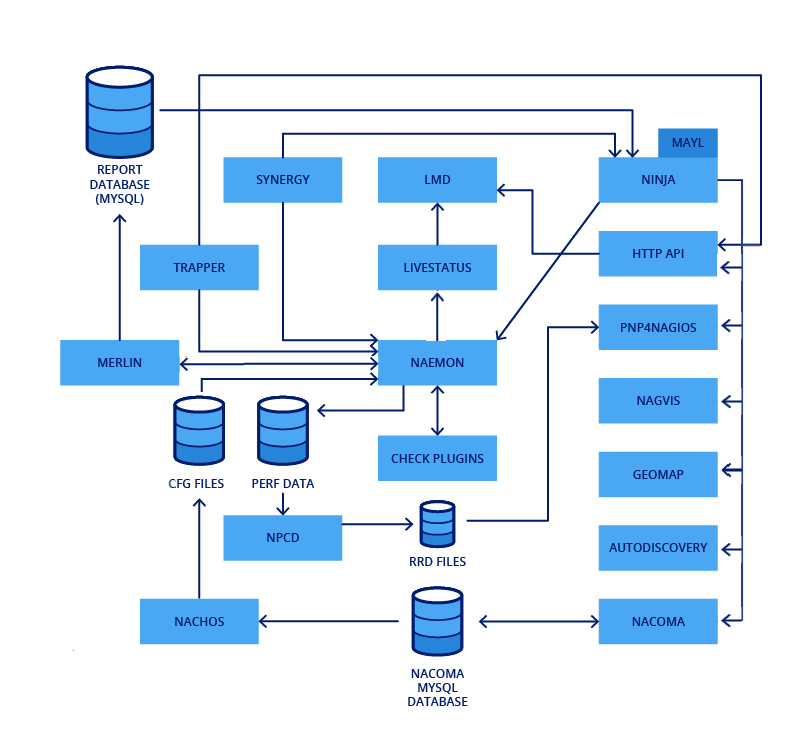
The main components of OP5 Monitor are described below.
Naemon
OP5 Monitor is built on top of the Naemon fork of Nagios. Naemon is the core of OP5 Monitor and is responsible for scheduling checks, but the actual monitoring and notifications are handled by plugins. You can extend the functionality of Naemon by adding any existing Naemon or Nagios plugins, or developing your own.
For more information, see the official Naemon documentation.
Merlin
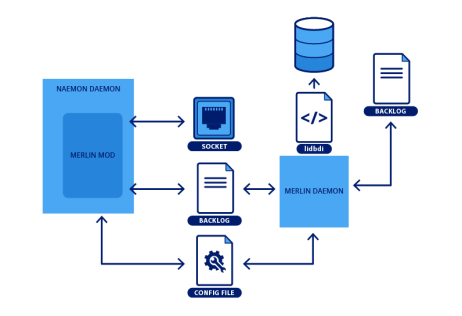
OP5 Monitor comes with a proprietary back end called Merlin. Merlin is the software component responsible for load balancing and distributed monitoring. It takes care of tasks like splitting configuration for pollers, making sure checks get spread out over peers, and synchronising object states. Merlin uses a custom protocol for exchanging state information and SSH for configuration management.
Merlin consists of the following components:
merlin-modmerlindmerlin database
For more information, see Scalable monitoring.
Nacoma and Nachos
Nacoma is the graphical utility for Naemon object configuration and various other aspects of OP5 Monitor, such as user permissions and management packs. It provides tools like clone and propagate and keeps a change log to track changes and which users made them.
Nacoma stores its settings in a MySQL database. From there it compiles Naemon configuration files for objects after each save. It is embedded inside Ninja and works as the back end for object configuration in the OP5 Monitor API.
Nachos works with Nacoma for configuration export and comes with its own API endpoints.
For more information, see Nachos API in OP5 Monitor API.
Livestatus
Livestatus is a middleware Naemon module that acts like an in-memory database. It contains real-time information about the states of objects in Naemon and related data. Livestatus is used by many components inside OP5 Monitor, but can also be queried through a socket or command-line tools such as mon.
Ninja
Ninja is the OP5 Monitor user interface, giving users the ability to perform functions such as:
- View status information and monitoring metrics for hosts and services.
- Search for log patterns.
- Configure business services.
- Generate reports.
For more information, see OP5 Monitor user interface in Features of OP5 Monitor.
Synergy
Synergy analyses information from hosts and services in Naemon to determine a high-level business service delivery status. You can configure Synergy in the OP5 Monitor user interface using the Business Services function.
For more information, see Monitor business services.
API
The OP5 Monitor API provides a RESTful interface for interacting with OP5 Monitor. You can use it to perform various operations, such as query the status of hosts and services, extract event information and performance metrics, submit check results, and change configuration. You can also run Nachos exports with the API and use Magellan for Autodiscovery.
The API is a useful tool for build integrations with third-party systems, such as reporting engines, management systems, and dashboards.
For more information, see OP5 Monitor API.
Plugins
OP5 Monitor is delivered with a standard set of plug-ins, which you can extend by installing other standard or custom plug-ins.
For more information, see Introduction to plugins.