Overview
The Overview app provides a customizable summary of the entities monitored by Obcerv.
This app allows a new user to immediately get a high-level overview of their estate and to expand into detailed metrics in areas of interest. This is useful when exploring your data and can help inform the configuration of the Dashboards app for more targeted monitoring.
To help you organize these metrics Obcerv provides dimension Hierarchy and Classification functionality.
Prerequisites
The following must be installed before installing the Overview App:
Lifecycle
Caution
Before upgrading to Overview 1.6.0, you must first uninstall all Obcerv apps. Due to Web Platform security changes, you need to upgrade all Obcerv apps at the same time. Make sure that you reinstall the latest mutually compatible versions of Obcerv apps. See the Obcerv Compatibility Matrix.
Install
- Create a chart config file, such as
app.yamlwith content similar to the following:
externalHostname: www.obcerv.local
ingress:
  annotations:
    kubernetes.io/ingress.class: "nginx"
    nginx.org/mergeable-ingress-type: "minion"
- The
externalHostnameparameter must match the DNS name configured for the Web-Console. - Your ingress controller may require custom annotations on the ingress (this example is for ingress-nginx).
- Install the chart:
helm install -f app.yaml obcerv-app-system-overview itrs/obcerv-app-system-overview \
             --version 1.6.0 -n <namespace> --wait
Uninstall
helm uninstall obcerv-app-system-overview -n itrs
Upgrade
To upgrade the app, first uninstall and then install it again using the new version.
Overview page
The Overview page provides a single pane from which you can check the status of your IT estate. Entities that you choose to monitor are conveniently grouped on this page.
You can quickly view entity groups and entities with real-time severity changes. As updates are received, summary statistics and chip or tile colors change accordingly.
Switch between views
To switch between different views in the Overview page, click ![]() (View as Summary),
(View as Summary), ![]() (View as Tiles), or
(View as Tiles), or ![]() (View as Table).
(View as Table).
Depending on the view you are in, the number inside the tiles will have a different meaning. For example, in Summary view, the number corresponds to entities in the group with the same severity level. When you switch to Tiles view, the number refers to metrics or attributes with such severity in the entity.
In Tiles view, inactive entities are shown as tiles with a faded color, while snoozed entities are indicated as tiles with an added blue shade ( ).
).
Add a new entity group
Define groupings and filters to organize monitored entities.
- Click Add group.
- Provide a group name.
- On the Filter drop-down list, select options in Classifications, Attributes, or Dimensions to filter the classification.
Note
For each selection, you can click on the chip and choose a specific value to further refine the entity group. - On the Group By drop-down list, select options in Classifications, Attributes, and/or Dimensions to organize the entities.
- Click Save.
You’ll see a new entity group added in the Overview page. To edit the group, click .
View an entity group
Options you selected in Group By when adding the entity group are shown as chips beside the button.
To refresh the view of an entity group, click a chip to select or unselect it. You can select up to three chips, and reorder or switch between them.
Check the metrics and attributes of an entity
Each tile or table entry is colored according to its severity. You can drill-down data to the metrics or attributes level of an entity.
- From an entity group, hover on an entity tile to see an overview.
- Click an entity tile to see a tree view of the data associated with the selected entity.
- Expand the tree view and select an item to drill-down data. Metrics and attributes associated with the selected node in the tree view are shown on the right-hand side.
- In either the Metrics or Attributes sections, scroll down to see rows of available metrics or attributes and their values.
Note
You can also check the severity status at the metrics or attribute level by scrolling to theseverityrow.
Check entities with severity changes
Check entities that have real-time severity changes across an entity group. The color of the chip indicates the severity or snooze status change for each group.
- On an entity group, click
 .
You’ll see a list of entities that have the most recent severity changes. The count on the icon resets when you expand the list.
.
You’ll see a list of entities that have the most recent severity changes. The count on the icon resets when you expand the list. - Click a chip to see a tree view of the data associated with the entity.
- Expand the tree view and select an item to drill-down data. Metrics and attributes associated with the selected node in the tree view are shown on the right-hand side.
Search for entities
Find an entity by searching for names, values, and strings. You can limit or delimit the results using several options.
- From the Overview page, click the search box. The search window appears.
- On the Context drop-down list, select your preferred context to search within.
- Type your keywords in the search box.
Note
To get individual matches with two or more keywords, put your search terms inside quotes (for example,"gateway-nightly"). - Click Search descendants if you want to show parent entities with children that match the search criteria. Selecting this option may impact system performance. This option is disabled if no context is selected.
- Click Include search matches to conveniently highlight the keywords in the search results.
- Click Classified only to get results that have a classification policy.
- Choose types in Scope to limit your search (for example, metrics). Each type has a corresponding icon at the beginning of the search result to help you sort the results.
- Select whether to include active or inactive entities in Status.
- Select which severity levels to include in Severity.
- In Classification, choose to search entities with a specific classification.
- Click a search result to review the details in tree view.
Hierarchies
The Hierarchies page shows the rules that Obcerv uses to organize the hierarchy of entities and metrics. This is also the hierarchy used in the Overview > Metrics section.
Defining the hierarchy of entities is important for the following reasons:
- Propagating attributes down to the child entities.
- Propagating severity status up to the parent entity.
The dimensions of an entity have no inherent hierarchy so this must be added by Obcerv. This occurs in the following ways:
- The platform contains preconfigured rules for many scenarios.
- The query service does automatic inference of hierarchies by looking at the global dimension key-space. Where it cannot infer a hierarchy from set-containment, a hierarchy is set based on alphabetical order.
- You can promote or modify inferred hierarchies from the Web Console.
- Only promoted or preconfigured hierarchies are used when propagating attributes and severities.

Promote an inferred hierarchy
- Click Edit to enter editing mode.
- Click the Promote button next to a dimension hierarchy.
- Click Save.
You can also promote all current inferred hierarchies using the PROMOTE ALL button.
Re-order a hierarchy
- Click Edit to enter editing mode.
- Click the Order button next to a dimension hierarchy.
- Drag and drop dimensions to re-order the hierarchy.
- Click Confirm, then click Save.
Classifications
Entities in Obcerv are identified by their unique set of dimensions. However, different data sources may use different conventions for assigning dimensions. This means that entities that are similar conceptually may have very different dimensions and be difficult to capture in one query.
Consider the following two entities as an example:
- Geneos data:
[probe=CENTOS7-MLG5, managedEntity=CENTOS7-MLG5, type=All, sampler=Disk, dataview=Disk, row=/boot] - Collection Agent plugin data:
[hostname, device, volume]
Both entities represent disks, but have very different dimensions.
To resolve this problem you can create policies that assign special attributes to entities called classifications. You can then use classifications to easily create simple queries.
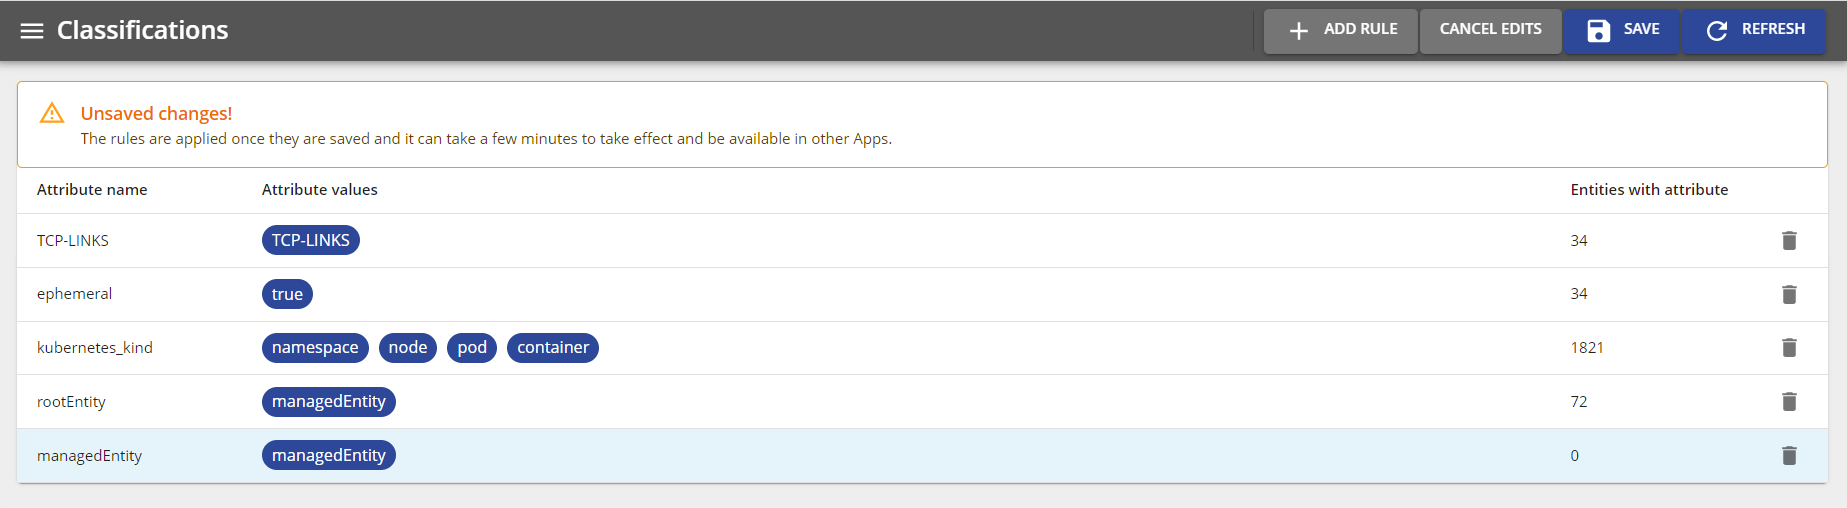
The Classifications page shows all current policies used to assign classification attributes.
Create a new classification policy
To create a new policy that assigns classifications:
- Click Edit to enter editing mode.
- Click the Add rule button.
- Specify an Attribute Name. This is the attribute that attached to all entities this policy effects.
- Specify one or more policy rules. You must specify an Attribute Value and a pattern that defines Where each policy rule is applied. To do this use an Expression.
- (optional) If you have set multiple policy rules you can order them using the arrow buttons.
- Click OK, then click Save.
Edit a classification policy
To update an existing classification policy:
- Click Edit to enter editing mode.
- Select the menu button of the policy you want to change, then click Edit.
- Modify the Attribute Name.
- Add or modify policy rules. If you have set multiple policy rules you can order them using the arrow buttons or delete them using the delete button.
- Click OK, then click Save.