Geneos Architecture
Overview Copied
The Geneos product range is based on a three-tiered architecture that collects, processes, and visualizes data. The Geneos architecture is composed of different components, as shown in the diagram below.
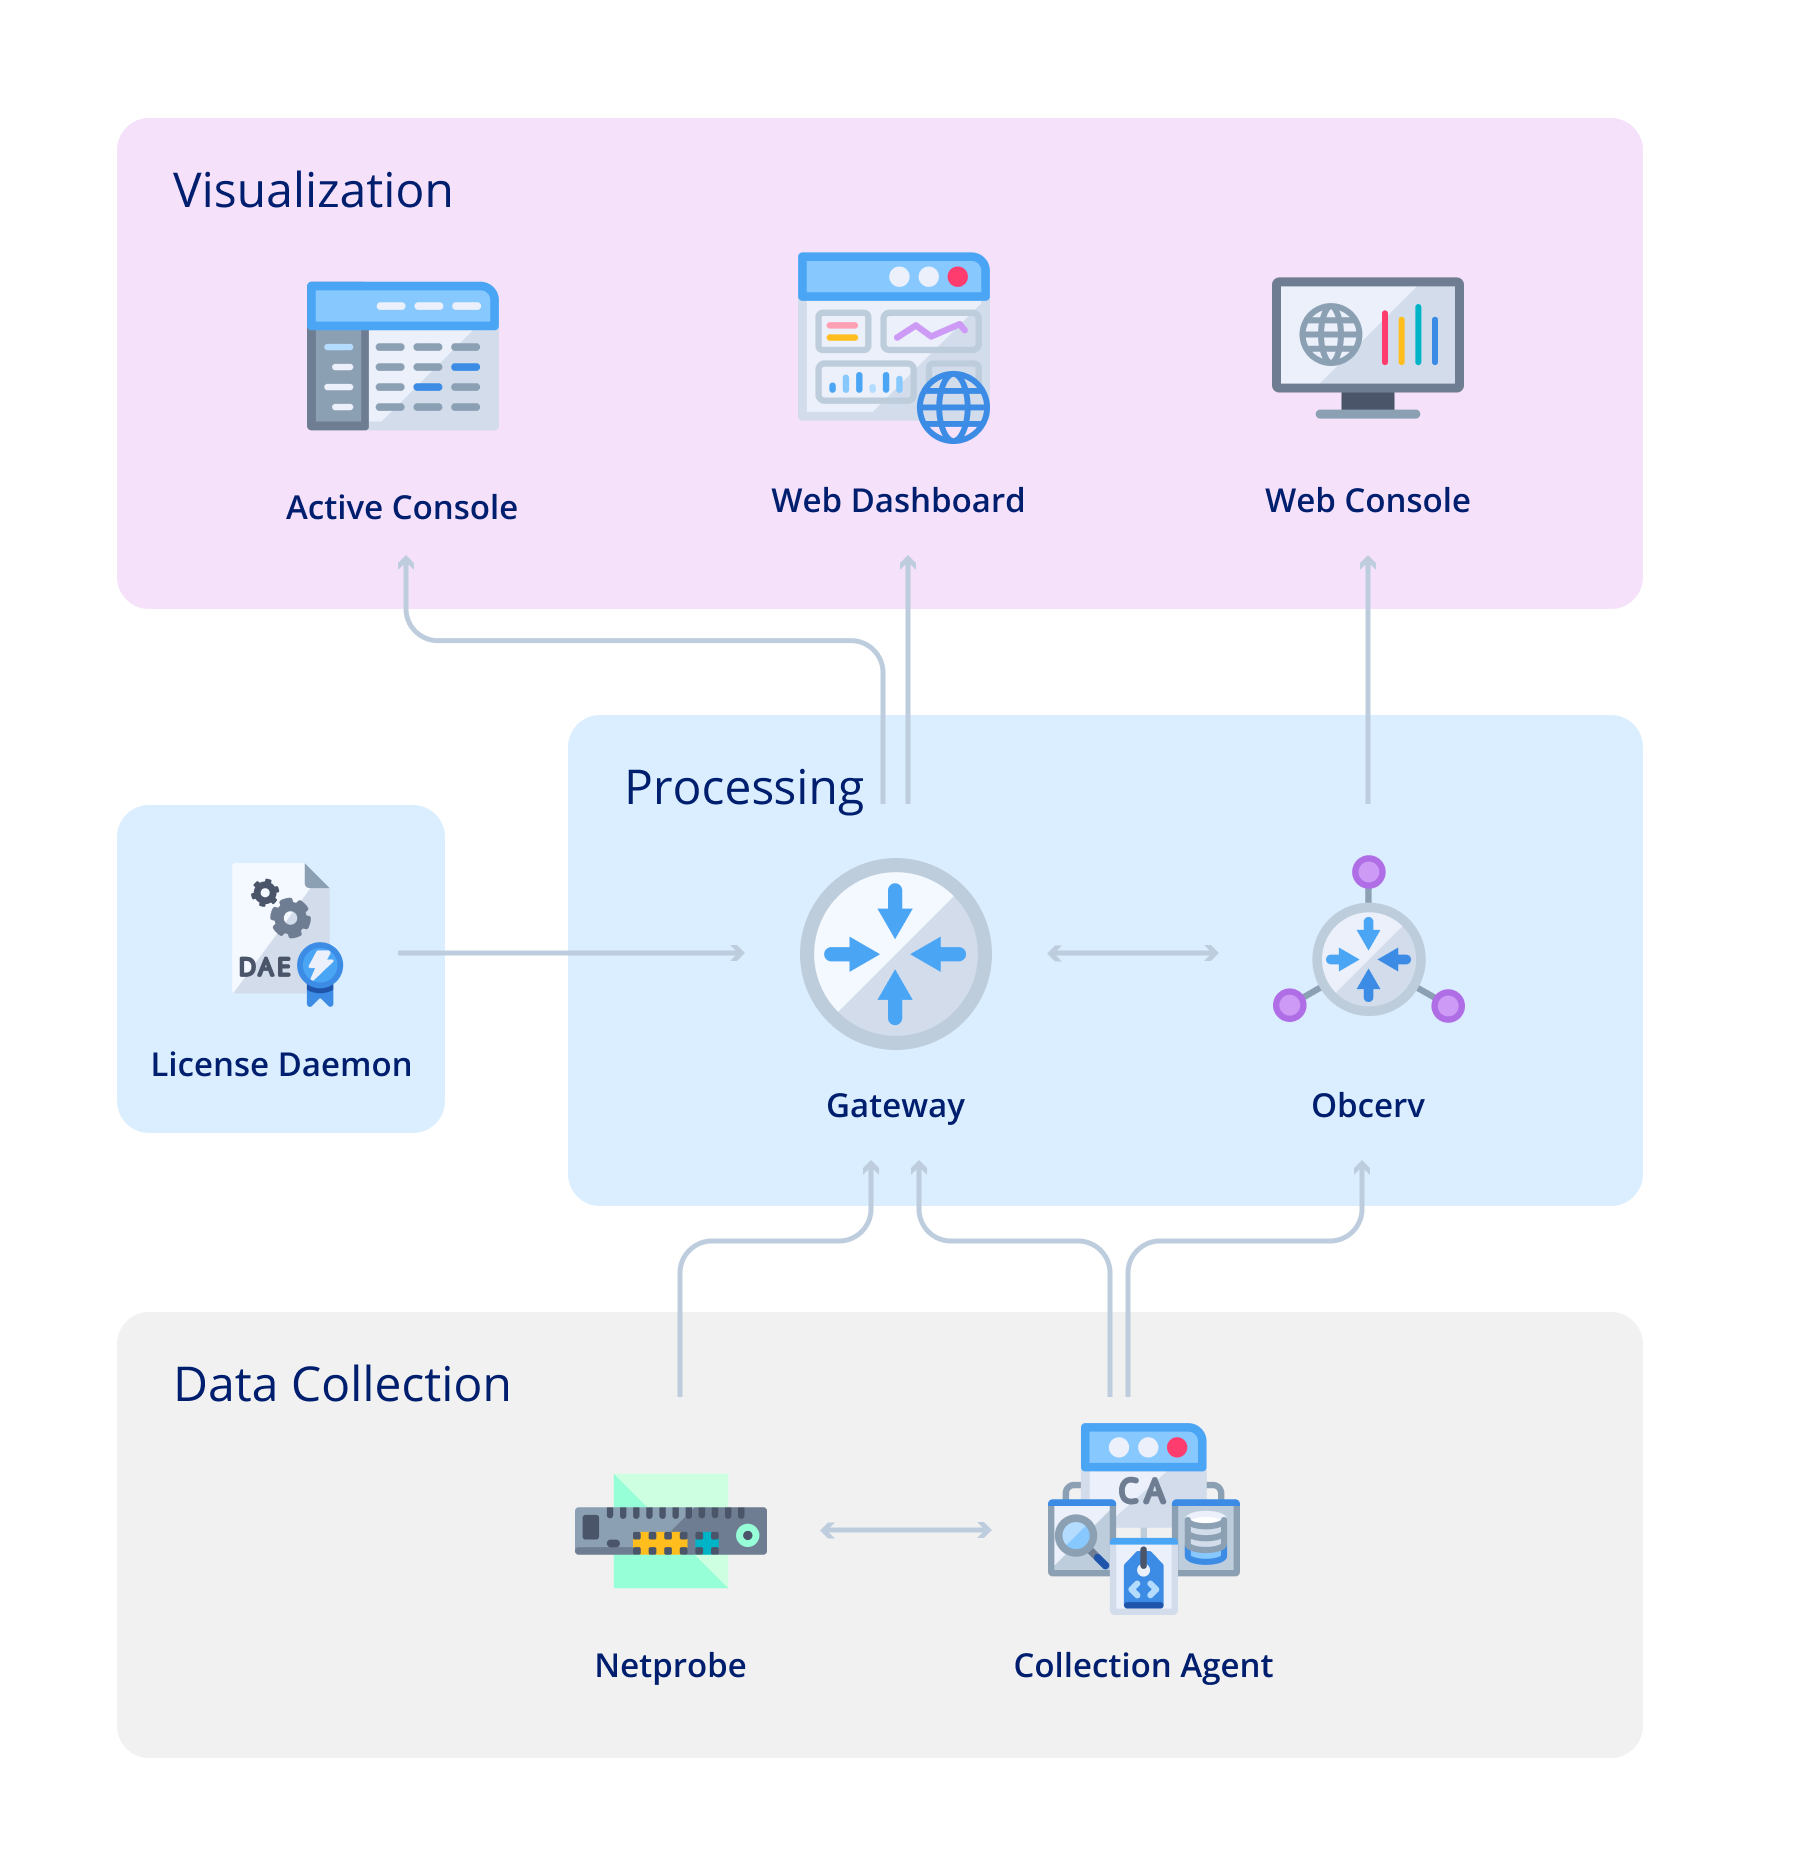
The Netprobe and Collection Agent use plugins to collect data from a variety of sources, such as applications, operating systems, and network devices. The plugins can be configured to collect specific data types, such as metrics, logs, and events.
Once the data is collected, it is sent to the Gateway or Obcerv for processing. The Gateway and Obcerv use a variety of algorithms to process the data, such as filtering, aggregation, and normalization. This processing makes the data easier to manage and visualize.
The processed data can be visualized using customizable dashboards. These dashboards can be used to track performance, identify trends, and troubleshoot problems.
Data collection Copied
The data collection tier of the Geneos architecture is composed of the Netprobe, Collection Agent, and plugins. These components collect data such as metrics (server, process, containers), logs, and metadata. Netprobe and Collection Agent use plugins depending on the technology you want to monitor. Both can be run together to complement each other, or they can be run as standalone applications.
Plugins Copied
Plugins provide specific management and monitoring capabilities. They are run locally by the Netprobe or Collection Agent to collect data. With its wide range of plugins, Geneos can monitor and integrate with different technologies. To see the available Geneos plugins, see Plugins and integrations.
Netprobe Copied
Netprobe is a monitoring agent deployed on all the nodes you want to manage. It extracts data and metrics and sends them to a connected Gateway. Netprobes can execute control-type functions (view logs, list processes, restart applications) upon receiving commands from Gateways. To learn more about Netprobe, see the Introduction to Netprobe documentation.
Collection Agent Copied
The main difference between a Collection Agent and a Netprobe is that the Collection Agent uses dynamic plugins. Dynamic plugins can collect dimensional data and discover what is available to monitor. These collected data can be sent to Gateway, Obcerv, or Gateway Hub. To learn more about Collection Agent, see Introduction to Collection Agent.
Data processing Copied
The data processing tier of the Geneos architecture is composed of Gateway, Obcerv, and Gateway Hub. These components bring all the information together for observability and data analysis. Similar to the data collection components, they can be used together or as standalone processes.
Gateway Copied
Gateways provide configuration for and gather data asynchronously from one or more Netprobes. These collected data are analyzed in real-time.
Gateways perform tasks such as severity tagging (for example, marking a metric as OK, WARNING, or CRITICAL), execute commands and user scripts, and store data in databases. Gateways can be configured to share and get data from other Gateways, Obcerv, and Gateway Hub. To learn more about Gateway, see Gateway Introduction.
Obcerv Copied
Obcerv provides an intelligent correlation of data from multiple monitoring sources and provides insights on why events are occurring, which then helps users formulate the correct course of action. It can store metrics and logs and provide a centralized dashboard. These data can be integrated with Geneos. To learn more about Obcerv, see Obcerv documentation.
Data visualization Copied
Active Console Copied
Active Console is a standalone application that allows you to connect to and view the contents of Geneos Gateways. It has a graphical user interface (GUI) that presents high-level (via dashboards and graphs) and low-level (via tables and rows) real-time monitoring. It also allows control functionality, such as viewing alerts, executing commands, and running rules. To learn more about Active Console, see Introduction to Active Console documentation.
Web Dashboard Copied
Web Dashboard is a client and server web application that allows Active Dashboards to be published and viewed over the web. Existing Active Dashboards can be deployed to a centralized location and viewed remotely without requiring the installation of an Active Console. To learn more about Web Dashboard, see Web Dashboard.
Webslinger Copied
Webslinger is an application that provides the Gateway output in a view-only HTML format. It enables users and managers to view the status of their environment in near real-time via a web browser. To learn more about Webslinger, see Webslinger.
Utilities Copied
SSO Agent Copied
SSO Agent is a Java application that acts on behalf of Geneos components to authenticate users against the Windows Active Directory or Gateway Hub permissions. It generates SSO tokens used by Geneos components to determine the user’s permissions. To learn more about SSO Agent, see SSO Agent User Guide.
Licensing Copied
Many features in the Gateway, including running the Gateway itself, require a license to function. These are acquired from the Geneos Licence Daemon, to which the Gateway connects. To learn more about licenses, see Gateway Licensing.