Headroom
Headroom is one of the basic concepts used in Capacity Planner. Headroom indicates the number of reference VMs that can fit into a server or cluster before running into some capacity constraint. The headroom is based on the currently selected reference VM and host.
This panel is available for VMs, hosts, and non-host groupings (for example, clusters or data stores).
Both, metrics that have capacity values assigned and ones that do not have them, appear in the headroom dialog window.
View headroom information Copied
To view the detailed information about a headroom for any entity, follow these steps:
- Right-click a segment in the sunburst.
- In the menu that appears, select Headroom. A baseline summary window opens for the selected entity.
- Select a tab in the top-right of the window to see the required detailed information. Available tabs are:
- Headroom — information about the used and available headroom for the selected entity.
- Workloads — information about the CPU and memory demands for the selected entity.
- CPU — a histogram showing the breakdown of CPU utilisation of all VM workloads at that point in the hierarchy.
- Memory — a histogram showing the breakdown of memory utilisation of all VM workloads at that point in the hierarchy.
In the Headroom tab you can find information about the used and available headroom for that entity. The headroom calculations are based on the currently selected reference VM and host, and the values of each metric using the selected measure in the Model panel. For more information, see Statistical summaries.
The headroom tab contains a number of panels, tabs, bar charts, and metric calculations. See below for how to correctly interpret these panels.
Note
The Headroom tab displays different details depending on what entity you are viewing (for example, a host, a VM or a cluster).
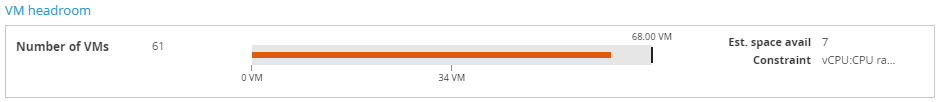
VM headroom Copied
This section displays overview information about VM headroom:
- Number of VMs — number of VMs available for the selected entity, for example for a cluster or a host.
- Est. space avail — number of VMs that can be placed into this segment before running into a capacity constraint.
- Constraint — primary constraining metric of the entity.
- Redundant servers — only available for clusters. The number of redundant servers available in the cluster. If 3 or more servers are redundant,
3+is shown, otherwise the exact number of redundant servers is shown. - Bar chart — shows the total capacity available, how many VMs you currently have, and how many you still have space for. The number to the right of the bar indicates the maximum number of VMs. The colour of the line changes from blue, through green to red, indicating how close this entity is to capacity.
Metrics summary Copied
In this section the headroom details are broken down for each metric. The demand profile view sorts VMs into resource utilisation categories which show the CPU and memory headroom of each VM.
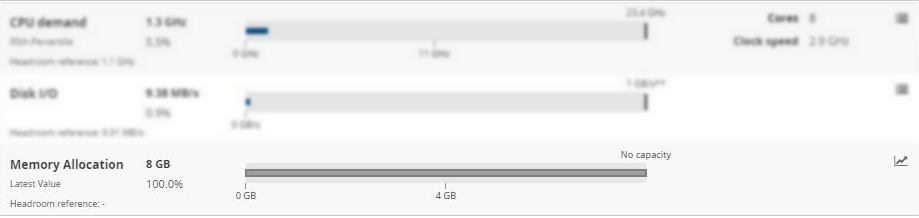
Memory demand Copied
This view provides a bar chart of the memory utilisation categories, and metadata from each VM.
- Memory demand — current memory demand. This is also reflected by the line in the bar chart.
- 99th percentile — the default measure for memory utilisation is the 99th percentile. This can be changed using the Models panel. The value applies to the period of time for which this model was built.
- Headroom reference — the equivalent measure for the headroom reference used in the calculations.
- Capacity — the maximum capacity this server, cluster, or other entity has for memory.
- Redundant servers — only available for clusters. It shows the number of redundant servers.
- Bar chart — shows the chosen measure of resource utilisation against available capacity.
- The colour of the line changes from blue, through green, to red, indicating how close to capacity the entity is.
- Dotted line indicates how much available space there is. Hover over this line to see how many reference VMs you can fit in the available space before you run into the memory constraints.
- Plotted area of the bar chart is the reserve headroom. This means that this space cannot be used. By default, the memory reserve headroom is 40%.
- N+1 and N+2 indicators are only displayed when you are viewing headroom details of a cluster. The indicators show at what point the given HA policies apply. For more information, refer to Cluster high availability (HA) policies.
- Box plots and Time series — to see statistical summaries of memory usage for the selected VM or host in the form of box plot charts or time series, click Options
 and select the desired option. Box plot charts give you a breakdown of where all these figures come from. For more information, see Box Plot Charts.
For clusters, only time series are available. Click the chart button to open the time series.
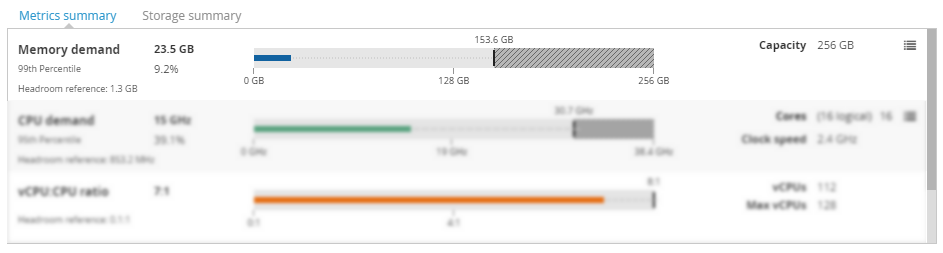
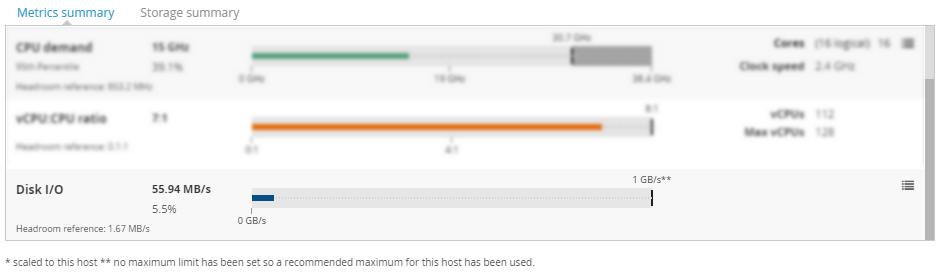
CPU demand Copied
This view provides a bar chart of the CPU utilisation categories, and metadata from each VM.
- CPU demand — current CPU demand. This is also reflected by the line in the bar chart.
- 95th percentile — the default measure for CPU is the 95th percentile. This can be changed using the Models panel. The number displayed here shows the aggregate of the 95th percentile of the servers at this point in the hierarchy.
- Headroom reference — the equivalent measure for the headroom reference used in the calculations.
- Cores— the number of total cores allocated to this workload, VM, or server.
- Clock speed — only available for VMs and hosts. It displays the clock speed of the server.
- Redundant servers — only available for clusters. It shows the number of redundant servers.
- Bar chart — shows the total capacity available.
- The colour of the line changes from blue, through green, to red, indicating how close to capacity the entity is.
- Dotted line indicates how much available space there is. Hover over this line to see how many reference VMs you can fit in the available space before you run into the CPU constraints.
- Plotted area of the bar chart is the reserve headroom. This means that this space cannot be used. By default, the memory reserve headroom is 20%.
- N+1 and N+2 indicators are only displayed when you are viewing headroom details of a cluster. The indicators show at what point the given HA policies apply. For more information, refer to Cluster high availability (HA) policies.
- Box plots and Time series— to see statistical summaries of CPU usage for the selected VM or host in the form of box plot charts or time series, click Options
and select the desired option. Box plot charts give you a breakdown of where all these figures come from. For more information, see Box Plot Charts.
For clusters, only time series are available. Click the chart button
to open the time series.
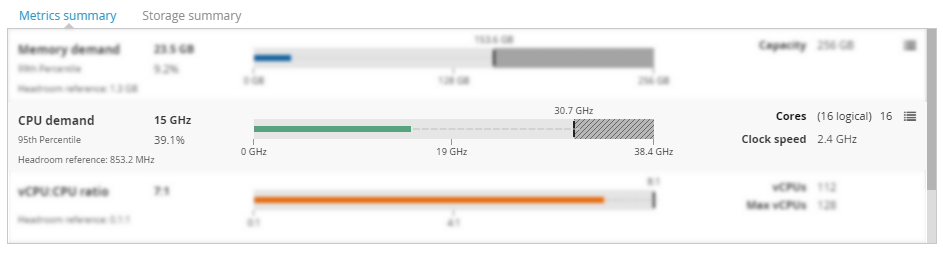
vCPU:CPU ratio Copied
This view provides a bar chart of vCPU:CPU ratio. The view is available for all entities except the VM.
- vCPU:CPU ratio — the ratio of allocated vCPUs at this point in the hierarchy to aggregate physical CPUs available across all servers at this point in the hierarchy.
- Headroom reference — the headroom reference core allocation.
- vCPUs — total number of allocated virtual CPUs.
- Max vCPUs — the maximum allowable virtual CPUs that can be allocated considering the maximum allowable vCPU ratio.
- Redundant servers — only available for clusters. It shows the number of redundant servers.
- Bar chart — shows the total capacity available.
- The colour of the line changes from blue, through green, to red, indicating how close to capacity your are.
- Dotted line indicates the amount of available space. Hover over this line to see how many reference VMs you can fit in the available space before you run into the CPU constraints.
- N+1 and N+2 indicators are only displayed when you are viewing headroom details of a cluster. The indicators show at what point the given HA policies apply. For more information, refer to Cluster high availability (HA) policies.

Disk I/O Copied
To see the details of this metric, scroll the section down.
- Disk I/O — the measure of I/O generated from this workload, VM, or server.
- Headroom reference — the measure of I/O from the reference workload.
- Redundant servers — only available for clusters. It shows the number of redundant servers.
- Bar chart — shows the total capacity available. I/O does not have a hard capacity but is set to
1GBps.- The colour of the line changes from blue, through green, to red, indicating how close to capacity the entity is.
- Dotted line indicates how much available space there is. Hover over this line to see how many reference VMs you can fit in the available space before you run into the I/O CPU constraints.
- N+1 and N+2 indicators are only displayed when you are viewing headroom details of a cluster. The indicators show at what point the given HA policies apply. For more information, refer to Cluster high availability (HA) policies.
- Box plots — to see statistical summaries of Disk I/O usage for the selected VM or host in the form of box plot charts, click Options
and select box plots. Box plot charts give you a breakdown of where all these figures come from. For more information, see Box Plot Charts.
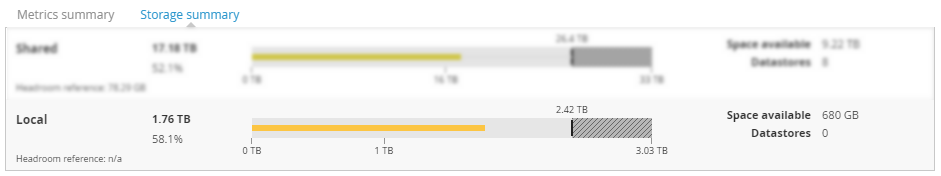
Storage summary Copied
In this section the headroom details are broken down for storage. The view is available for all entities except the VM.
Shared Copied
This view provides information about shared storage.
- Shared— total amount of available shared storage from this point in the hierarchy.
- Headroom reference — total amount of shared storage that the headroom reference uses.
- Space available — available space across the shared storage.
- Datastores — total number of shared datastores available to entities at this point of the hierarchy.
- Bar chart — shows the total capacity available.
- The colour of the line changes from blue, through green, to red, indicating how close to capacity the entity is.
- Dotted line indicates how much available space there is. Hover over this line to see how many reference VMs you can fit in the available space before you run into the CPU constraints.
- Plotted area of the bar chart is the reserve headroom. This means that this space cannot be used. By default, the shared storage reserve headroom is 20%.
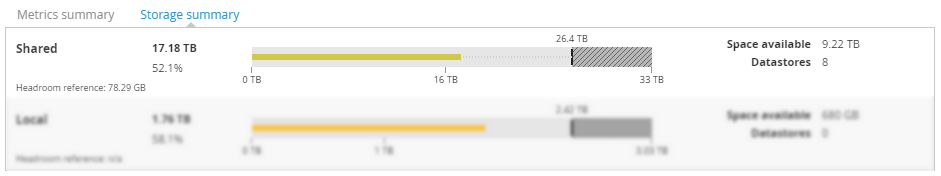
Local Copied
This view provides information about local storage. Details for local storage are only displayed for physical servers.
- Local— total amount of available local storage from this point in the hierarchy.
- Headroom reference — total amount of local storage that the headroom reference uses.
- Space available — total local storage space available.
- Datastores — number of local storage entities at this point in the hierarchy.
- Bar chart — shows the capacity and utilisation of local storage.
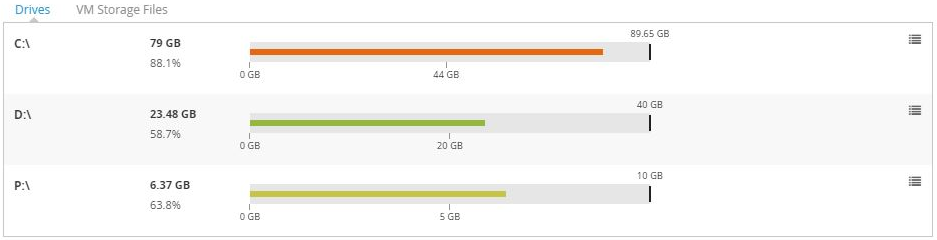
Drives Copied
This section is only available when viewing headroom for a VM. In this section you are provided with details of all OS level drives that VM can use, the capacity of each drive, and the latest utilisation of that drive.
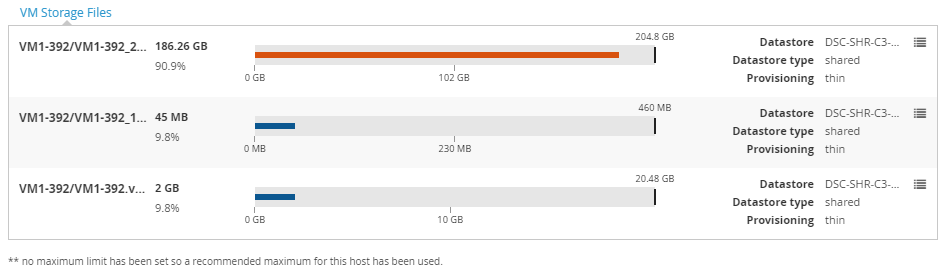
VM storage files Copied
This section is only available when you are viewing headroom for a VM. In this section you can see each virtual machine disk (VMDK) that is configured for this VM. The following information for each VMKD is shown:
- VMDK Name
- Total utilisation of VMDK
- Capacity of VMDK
- The datastore that the VMDK resides upon and whether that datastore is shared.
- Whether or not the VMDK is thick or thin provisioned
Metrics with no capacity assigned Copied
Both, metrics that have capacity values assigned and ones that do not have them, appear in the headroom dialog window. If a metric is configured to be visible in the headroom dialog and does not have a capacity value, Capacity Planner only displays the numerical values of the selected measure, for number of quotes per second.
In this case, the Bar chart indicates the following:* The colour of the line does not change and is always grey.
- Because there is no capacity assigned, there is no vertical black line at the end of the bar chart.
Time series — to see the time series for this metric, click the chart button ![]() .
.