Basic concepts
In this section, you will learn about basic Capacity Planner concepts. Understanding these concepts will make it easier for you to read this documentation, to navigate the product and communicate with your account representatives regarding your Capacity Planner setup.
Baseline Copied
It is important to distinguish between the following terms: baseline view, baseline summary and a model.
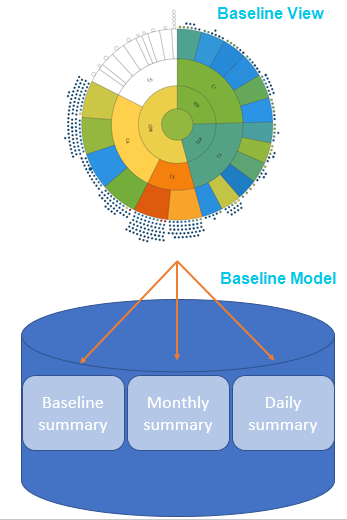
A baseline represents a data model. Each model is a collection of data from a database and it has a start date and an end date. A Baseline View is a statistical demand view of your infrastructure, summarising utilisation of resources over a period of time. The default view is always available and typically presents a summary of 84 days of data. The view is also where you can look at growth trends and headroom for growth. The primary visualisation in the Baseline View is called the sunburst. Each element of the sunburst represents a component part of your current infrastructure.
Every project has a default baseline view that presents statistical summaries of all data in a 84 day or 12 week rolling window. Within that model there are a number of summaries. By default, there are three summaries:
- Baseline Summary — a single collection of statistical measures for every entity and metric covering the entire duration of the baseline. This is used by default.
- Monthly Summary — a collection of statistical measures for every entity and metric per calendar month that is covered by the baseline time period.
- Daily Summary — a collection of statistical measures for every entity and metric per day that is covered by the baseline time period.
The Baseline View is presented in the interface using the sunburst chart visualisation.
Baseline View can be configured in many ways to represent the data in such a way that makes the most sense depending on your IT infrastructure. This is achieved using groupings and grouping values.
When you create a new Baseline View from your model, and you select a new time period for that view, a new model is created. Your Baseline View is based on that model. That model has all the summaries available, but those summaries are based on the new time period. This is used extensively for monthly reporting. Typically, you would create a new model containing all data for the required calendar month and then use that as a basis for reporting and forecasting. If you create a new view to record a particular month or other time period, it will always be available to you and it will not change or update as a result of getting new data in Capacity Planner.
If you do not change the dates, and simply create a new view of the existing model, you will have another Baseline View based on the same model.
Creating time boxed views in this way is the best way to store a snapshot of the environment indefinitely.
For more information, see Baseline View overview.
Benchmark scores Copied
In order to accurately model the relative differences in capability, Capacity Planner uses a concept of benchmark scores.
Each host segment in the Capacity Planner has a calculated industry standard benchmark, the SPECint rate. This benchmark data is produced by the Standard Performance Evaluation Corporation (SPEC). normalises CPU utilisation on each machine to these SPECints. This is the equivalent utilisation expressed as a function of the chipset benchmark score.
For more information, see Benchmarking.
Entity Copied
The term entity is used to refer to a managed object in Capacity Planner. This is typically a physical server, virtual machine, virtual host, network device, interface, virtual machine disk file or a drive.
The term is mainly used in Reporting. For more information, see Using advanced reports.
Grouping Copied
Groupings are slices of data collected by a particular attribute. Each attribute forms a single grouping and is drawn as a ring on your . All rings are concentric, with the centre circle forming its own grouping. Groupings can represent any entity that you wish to monitor in your IT infrastructure, such as physical servers, hosts, clusters, applications, server types, tiers, VM state, and so on.
Default grouping values are automatically uploaded from your Capacity Planner chosen monitoring tool. For example, vCenter and Geneos have tags and attributes, respectively. These are automatically brought into Capacity Planner
Configuring Baseline View using grouping values provides you with the ability to view the summary data for the baseline in a number of ways depending on your business needs. For example, you can arrange the groupings in the Baseline View to view the data by application, by component, or by environment. Adding more groupings to the Baseline View creates a sophisticated view of exactly how your VMs are being tasked across your IT infrastructure to help you make more informed decisions about your business.
For more information about adding, removing and rearranging groupings, see Groupings.
Headroom Copied
Headroom indicates the number of reference VMs that can fit into a server or cluster before running into some capacity constraint. The headroom is based on the currently selected reference VM and host.
For more information, see Headroom.
Percentile Copied
The percentile figure is the measure defining the amount of time a metric was at a particular value over the course of the baseline used in the scenario. For example, if you pick the 99th percentile for CPU right-sizing, it means that the value used for CPU is the value which the metric has spent 1% of its time at or above over the period of time of the baseline.
Reference host Copied
The reference host is the most common type of server you have in your environment. Using a reference host means that VMs are drawn in the sunburst relative to a particular server.
For more information, see Benchmarking.
Reference workload Copied
The Baseline View lets you set a reference host or reference workload. By setting a reference you can better understand your demand profile across your IT infrastructure. The reference workload and host are used for headroom calculations. Changing your reference host or workload, rather than using a calculated average, may mean you get a more accurate view of your IT infrastructure.
For more information, see Reference Workload .
Reports Copied
Reports are a very powerful and flexible feature of . Among other features, they allow you to:
- Summarise utilisation over any time period that has been modelled for a group of entities.
- Create RAG reports indicating where any breaches may have occurred.
- Analyse relationships between metrics and check how many inactive VMs you have.
- Report on cost trends and recommendations for your cloud environment.
Most reports also provide a drill-through capability to view data at successively lower levels of granularity. They can be run against different entity types (for example, physical servers, virtual machines, or hosts). Reports have configurable parameters to provide maximum flexibility, they can be saved and shared.
For more information, see Using advanced reports.
Right-sizing Copied
Forward Thinking scenario modelling helps you rationalise your IT infrastructure by automatically optimising the vCPU allocation across all workloads under a host or another segment. When you migrate workloads, you get an option to right-size servers after this migration operation is executed. We recommend that you do as this ensures that the VMs created are sized accordingly based on the capabilities of the target hardware platform.
For more information, see Right-sizing
Sunburst view Copied
The sunburst is the central part of the screen where your Baseline View or Forward Thinking scenario is visualised.
Graphically, the sunburst is divided into the following elements:
- Rings — represent groupings and can be rearranged.
- Segments — rings are divided into segments, each segment represents a grouping value.
- Centre circle — a segment of its own, with details that can be viewed just like any other segment.
- Small circles around the sunburst — represent your workloads.
Colours of the elements on the sunburst carry particular meaning . For more information, see Sunburst Colours.
For more information about the meaning of rings and segments, see Sunburst in Application interface
Timeburst view Copied
The timeburst is the central part of the screen where your is visualised. You can switch from the sunburst to the timeburst view using the View menu in the application menu bar or by right-clicking a segment in the sunburst and selecting Show timeburst view.
The timeburst provides a time dimension version to the sunburst. In the sunburst, all machines or instances are represented in the same way regardless of how long they have been running. For example, there is no difference in the representation of a machine that ran for an hour and one that ran 24/7, or when machines were active and when these were not.
In the timeburst, you can find daily patterns and visualise application behaviour. You can observe the activity levels of all your workloads based on which you can see that potential savings could be made if, for example, idle machines are switched off. For more information about potential savings and cloud optimisation options, see Recommend.
For more information, see Timeburst interface