AWS summary dashboard
The AWS visual summary dashboard displays key information about the AWS state. This dashboard can be enabled if you are using an AWS solution. All the elements of the dashboard are click-through which means you can click them to see more information.
AWS spend and savings Copied
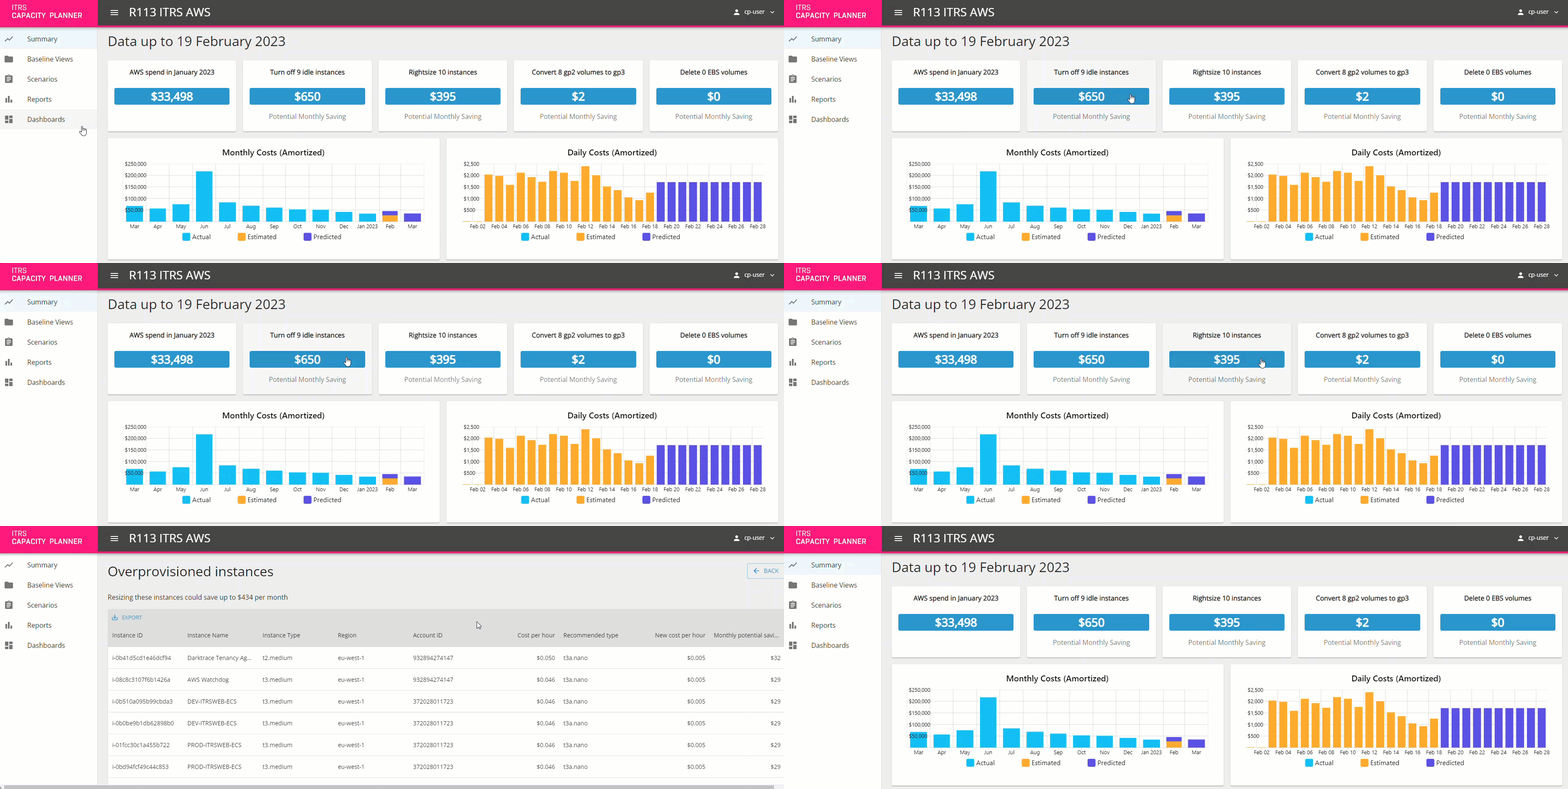
The first item you can see on the list is the total AWS spend in the last full calendar month. This relates to all spend in AWS, not just the EC2 compute spend.
There are also recommendations as to how you can save money by turning off idle instances. In this example, this would save $650 per month. Clicking the box opens an itemized list of the individual machines that the recommendation relates to, along with the monthly cost savings.
Similarly there is a recommendation for right-sizing or removing EBS volumes. Clicking through each of these displays a list of the individual machines that the recommendation relates to and the relative cost savings.

Monthly and daily costs Copied
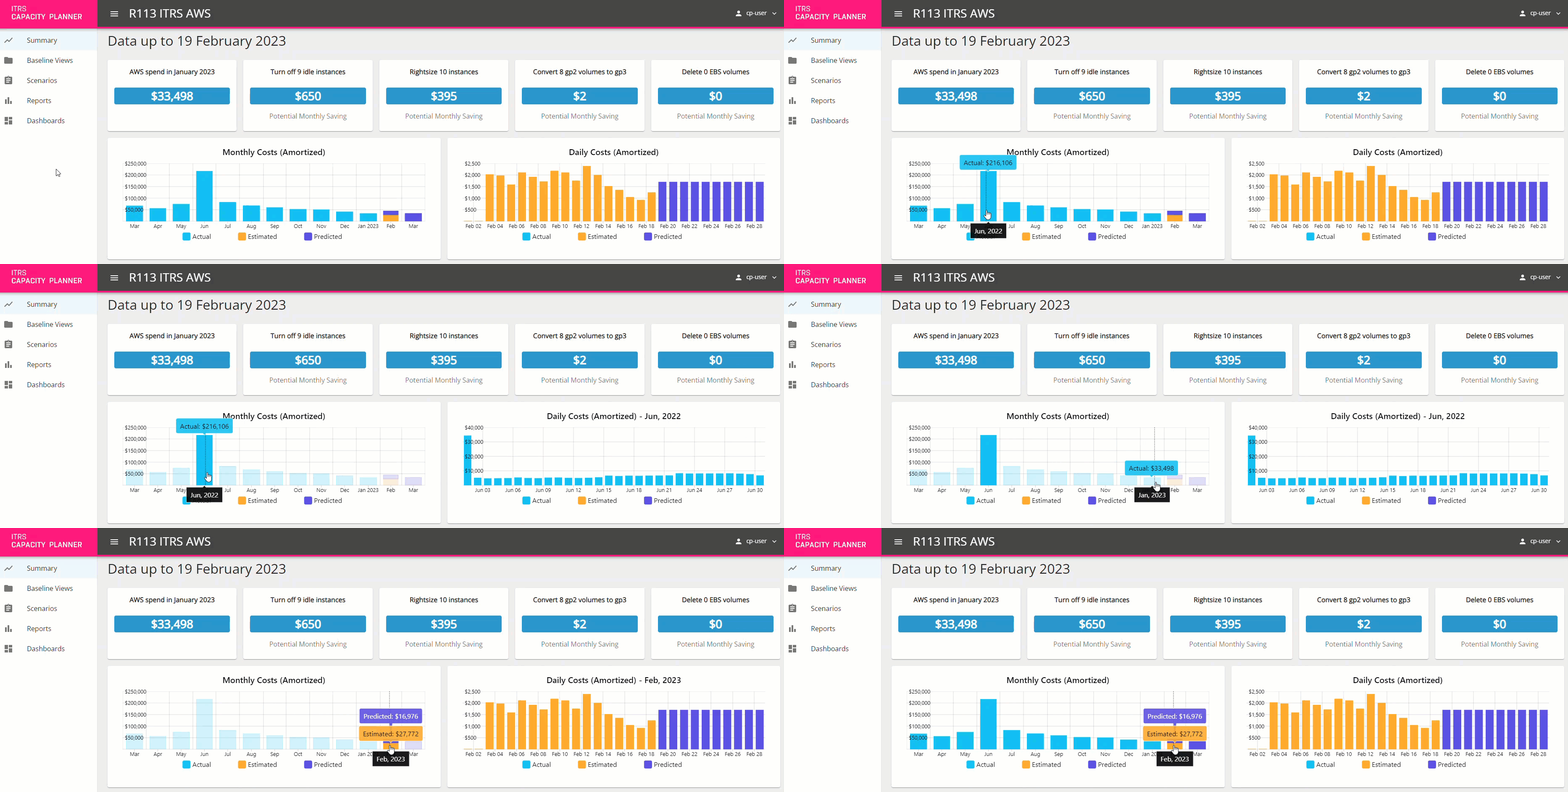
The Monthly Costs chart displays your month by month breakdown of spend across AWS. For the current month you can also see the estimated spend and the predicted spend. The estimated spend is what AWS are expected to bill you for that month. In the example below, the current month is February.
On the right hand side, the Daily Costs chart displays a breakdown of the costs by day through the current month. Here you can also see the detailed predicted spend into the following month.
Clicking any month on the Monthly Costs chart will give you the breakdown by day of when that cost occurred.
To reset the view, click the same vertical bar again.

Service costs Copied
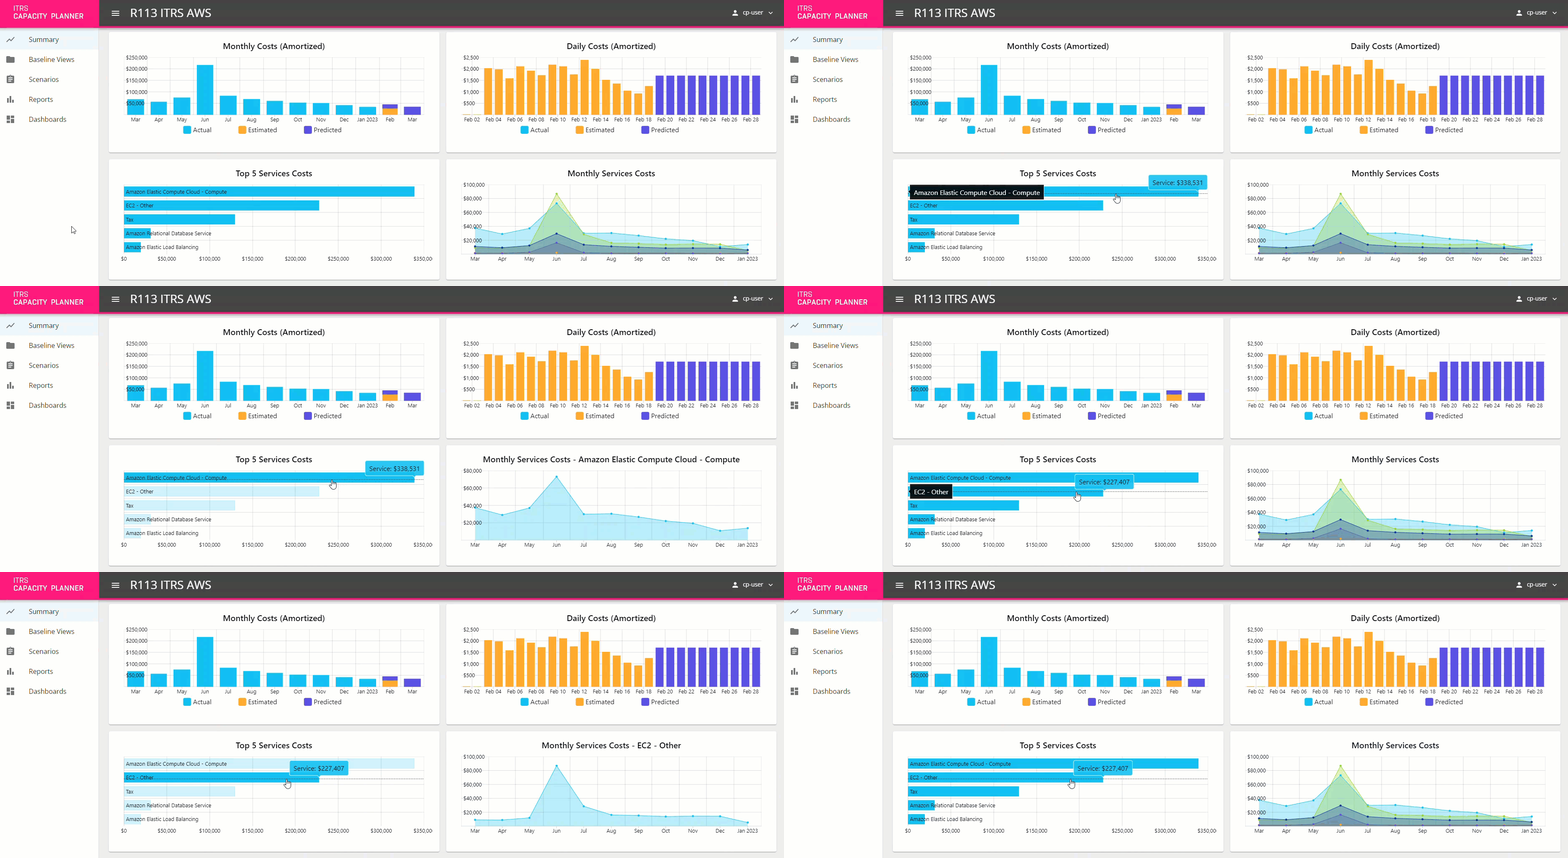
The Top 5 Services Costs chart displays a breakdown by the services that you are using. In the example, the Amazon Elastic Compute Cloud is the biggest cost followed by the EC2. Clicking on any of the horizontal bars will update the Monthly Service Costs chart to the right hand side where you can see how the service costs vary over each month of the year.
To reset the view, click the same horizontal bar again.
