What's New in Opsview
Overview
This page contains the list of all highlights that have recently been introduced in Opsview.
For detailed release notes for all versions of Opsview, see Opsview 6.x Release Notes .
For the list of issues that have been addressed in the Opsview Cloud version, see Opsview Cloud Release Notes .
Opsview 6.8.3
These are the highlights of this release:
- Default NRPE ciphers update.
- New
RELOADVIEW
permission. - Security fixes.
Default NRPE ciphers update
The default NRPE ciphers have been amended to work with both the old and new Infrastructure Agent. This change makes it easier for users to migrate from the old Infrastructure Agent to the new Infrastructure Agent.
For more information, see Default TLS Ciphers .
New RELOADVIEW permission
This new permission allows Opsview User Roles to view the Apply Changes status without being able to Apply Changes themselves. The RELOADACCESS
permission still controls which Roles are able to apply changes.
- Users who are granted the
RELOADVIEW
permission can only doGET
requests for/rest/reload
and can only view (read-only) the current state of the system. - Users who are additionally granted the
RELOADACCESS
permission can doGET
orPOST
requests for/rest/reload
and can view and make changes (read and write) to the system.
For more information, see Reload - Request Format .
Security fixes
The permissions for the Monitoring Collectors page have been updated to prevent unauthorized users from viewing clusters and collectors.
Opsview 6.8.2
These are the highlights of this release:
- New Infrastructure Agent.
- LDAP sync script updated with new functionality.
- Additional host information in tables.
- New
CONFIGURECLUSTER
permission. - Performance improvements.
- Security fixes.
New Infrastructure Agent
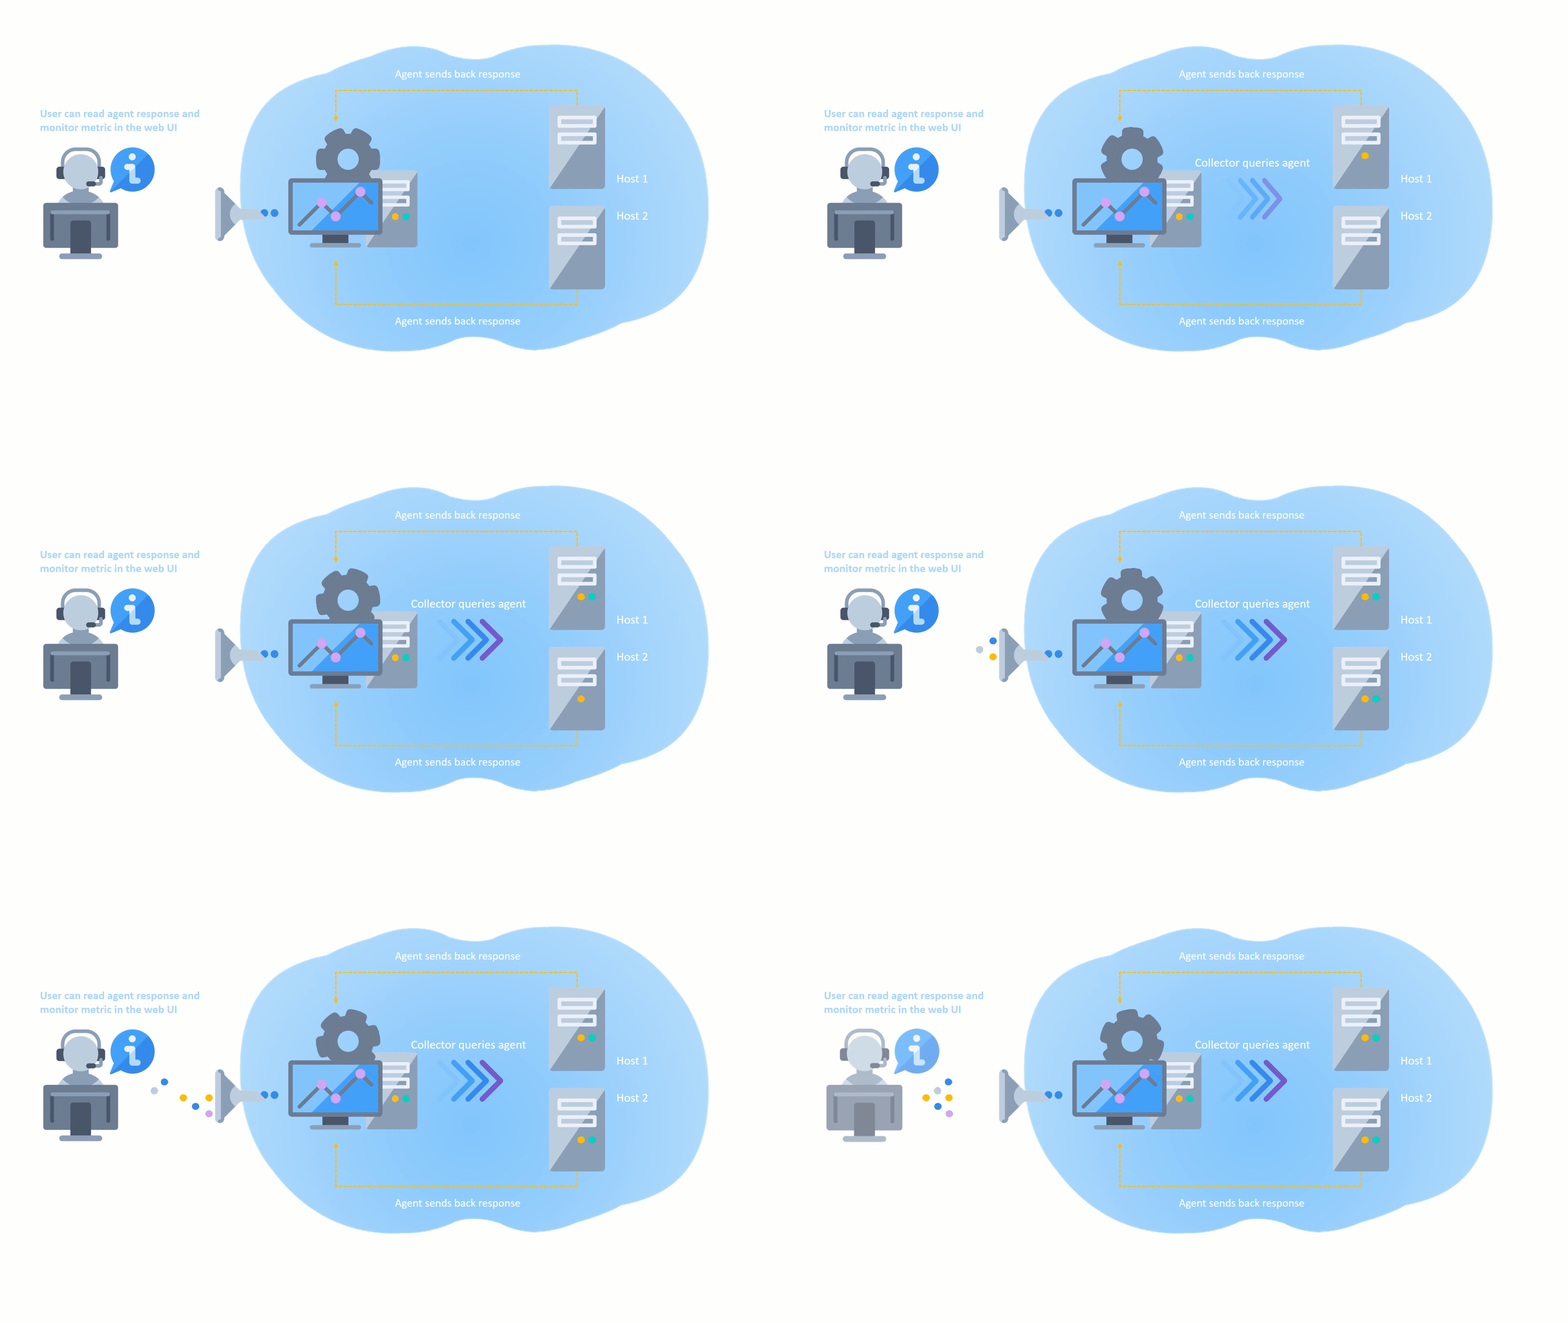
A new self-monitoring host template was added as part of Opsview deploy.
Support for easier certificate management using self-signed certificates.
- Secure cipher out of the box.
- It is no longer a requirement for a user to manually add certificates for secure communications.
Help documentation has been added to all Linux plugins.
LDAP sync script updated
Improved opsview_sync_ldap
script that is used for syncing Opsview users and roles with an LDAP or Active Directory server.
- Improved logging.
- Self-monitoring of LDAP sync status in Opsview.
- Support for multiple LDAP realms.
- Support for nested LDAP groups.
- Support for encrypted user secrets.
Group files must now have an .xml
extension to be processed correctly.
For more information, see LDAP and Active Directory .
Additional host information in tables
Many dashlets have new optional columns available:
- Host address
- Host description
- Host group
New CONFIGURECLUSTER permission
A new CONFIGURECLUSTER
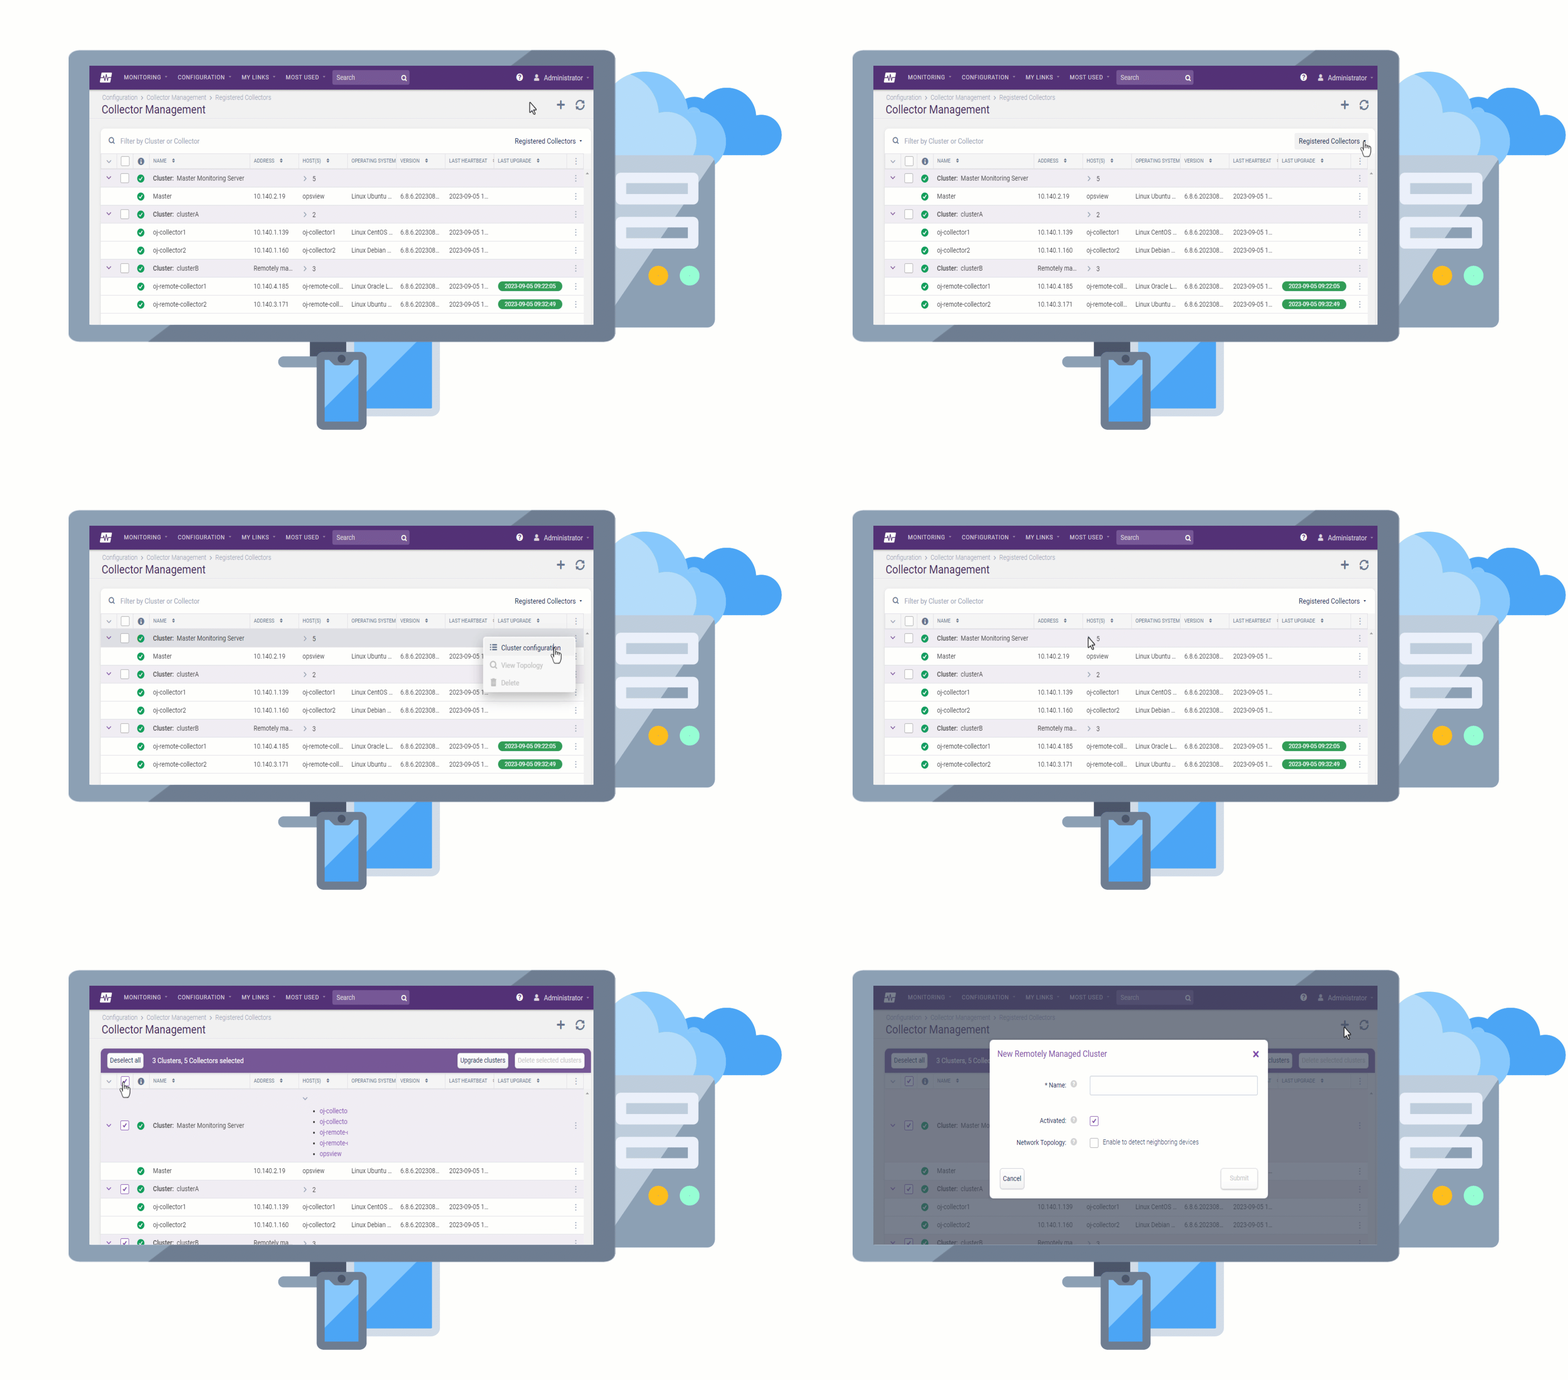
permission is now available that allows you to add empty clusters and manage them remotely.
For more information, see
Current role definitions
.
Performance improvements
The default message queue driver has been swapped from Kombu to Nucleon for all Python modules.
Security fixes
- Updated GPG key links for optimal security.
- The Opsview version is no longer displayed on the login page for unauthenticated users.
Opsview 6.8.0
These are the highlights of this release:
- UTF-8 support.
- New Windows and Linux agent open beta.
- Documentation migration.
- Dashboard updates.
- Flow Collector advanced options.
- New parameters for Status — Performance Metrics endpoint.
- Security fixes.
- Golang upgraded to 1.19.3.
- Opspack updates.
Supported Unicode Characters
Opsview now supports UTF-8 characters.
For more information, see Supported Unicode Characters .
New Windows and Linux agent open beta
The beta version of a new Windows and Linux infrastructure agent is now available to use and download at the Opsview Downloads website .
For more information, see the Installation and operation documentation .
Documentation migration
Opsview Knowledge Center will make way for ITRS Documentation as our new documentation platform.
Starting with the Opsview 6.8.0 release, you can find the documentation, including the ITRS Opsview Cloud Documentation , at ITRS Opsview Documentation .
You can still visit the Opsview Knowledge Center for older versions of documentation, which will be available until further notice.
Dashboard updates
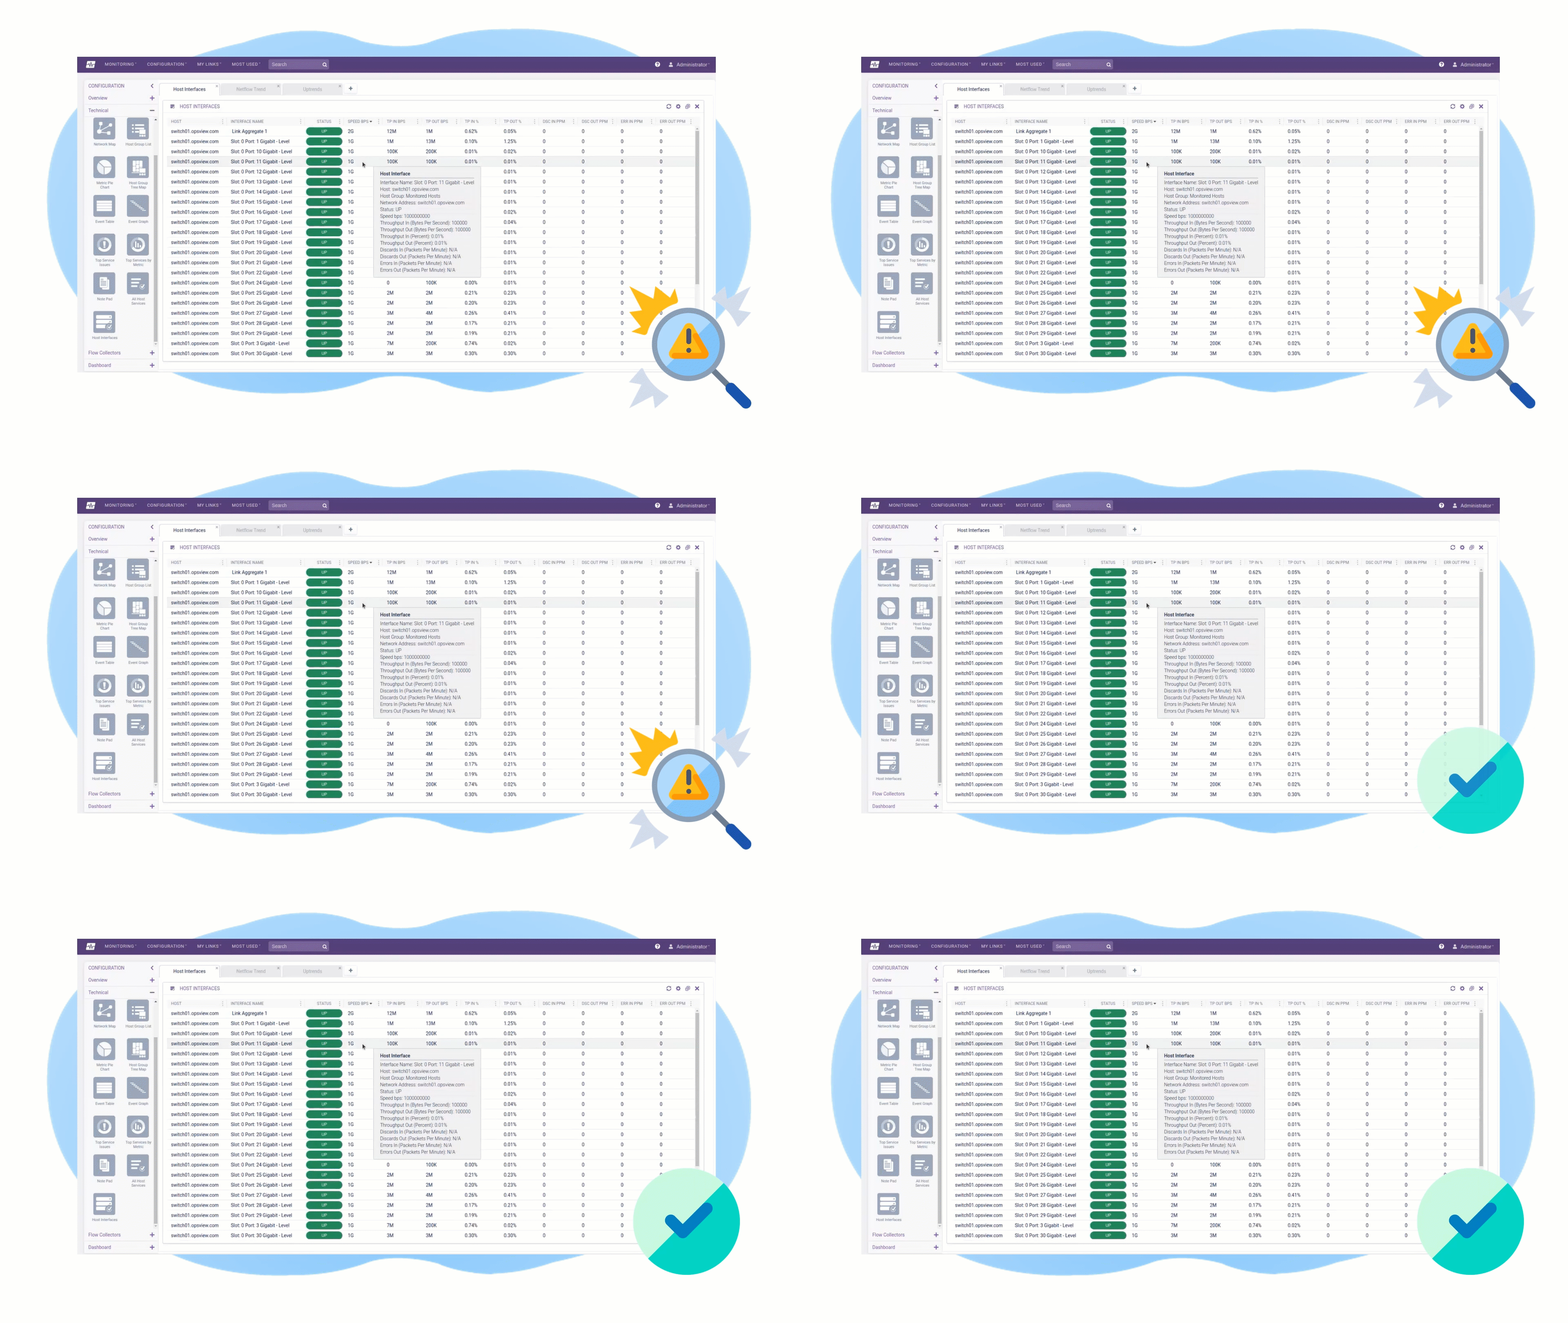
A new dashlet in Dashboard can display the speed, throughput, discards, and error information for each interface configured through the Host Interfaces Dashlet .
In Performance Graph , additional details are exported when saving graphs as images, with the ability to configure the graph balloon text format.
In some configuration fields, the
Metric Pie Chart
supports wildcards (%
) .
Top Services Issues
supports wildcards (%
) in some configuration fields, with the ability to summarize details for multiple services on the same host.
Top Service By Metric
supports wildcards (%
) in some configuration fields, with a new bar chart display, Host Group, and Host IP columns.
Flow Collector advanced options
The Flow Collector processing now sets a timeout for reverse DNS lookups. This improves the response time for loading Flow Collector dashlets when the flow data contains IP addresses where reverse DNS is slow.
To configure the timeout as well as the concurrency level for the reverse DNS lookups, see Advanced flow collector options .
New parameters for Status — Performance Metrics endpoint
The Status - Performance Metrics endpoint now accepts the include_hostgroup and include_hostip URL parameters.
Security fixes
- VMware and HyperV virtual appliances no longer ship with the default SNMP community strings configured.
- NetFlow: Prevent API command injection.
Golang upgraded to 1.19.3
The version of Golang used to build Opsview Monitor and associated plugins has been upgraded to 1.19.3 to improve security. As a result of this, support for legacy certificates has been removed from all Golang-based Opsview plugins. See Plugins in the Known Issues .
All Golang components are now compiled using the updated toolchain:
- Opspacks
- timeseries-influx
- Registry (etcd)
Opspack updates
The following Opspacks have been updated to improve security:
- Application - HAProxy (v2.1.1)
- Application - Jenkins (v2.0.1)
- Application - RabbitMQ - Node (v3.0.1)
- Application - Varnish Cache (v2.0.1)
- Application - Varnish Cache 3.0 (v2.0.1)
- Application - Zookeeper (v2.0.1)
- Cloud - AWS - AutoScaling CloudWatch (v2.1.1)
- Cloud - AWS - CloudWatch (v2.1.1)
- Cloud - AWS - DynamoDB CloudWatch (v2.1.1)
- Cloud - AWS - EC2 CloudWatch (v2.2.1)
- Cloud - AWS - ELB CloudWatch (v2.1.1)
- Cloud - AWS - RDS CloudWatch (v2.2.1)
- Cloud - AWS - Route53 CloudWatch (v2.1.1)
- Database - Etcd (v2.0.1)
- Opsview - Component - Datastore (v4.1.2)
- Opsview - Component - Load Balancer (v4.1.2)
- Opsview - Component - MessageQueue (v4.1.2)
- Opsview - Component - Registry (v3.0.2)
Opsview 6.7.6
These are the highlights in this release:
- New Windows and Linux Agent Beta.
- Network Topology security.
- New time range presets.
- Dashboard updates.
- Jasper Server upgrade to 8.1.0.
- Flow Collector improvements.
New Windows and Linux Agent Beta
A new agent for Windows and Linux based machines is now in closed beta. If you are interested in taking part in this closed beta, please reach out to either Customer Support or your account manager.
Network Topology security
A new Network Topology permission NTVIEWALL
has been added which, when applied to a role, allows a user to view any unimported nodes in the network topology map.
Also, two known issues related to Network Topology have been resolved to improve security.
New time range presets
The Events Viewer, Notifications, and Graph Center pages have access to new preset time durations. These are:
last full day
— last full 24 hour period (00:00 to 00:00).last full 7 days
— last 7 full 24 hour periods (00:00 to 00:00).last full week
— last full week, for example if used on Tuesday, this would be the previous Monday to Sunday.last full month
— last full month, for example if used on February 2, this would be January 1 to 31.
Dashboard updates
Added two new NetFlow dashlets:
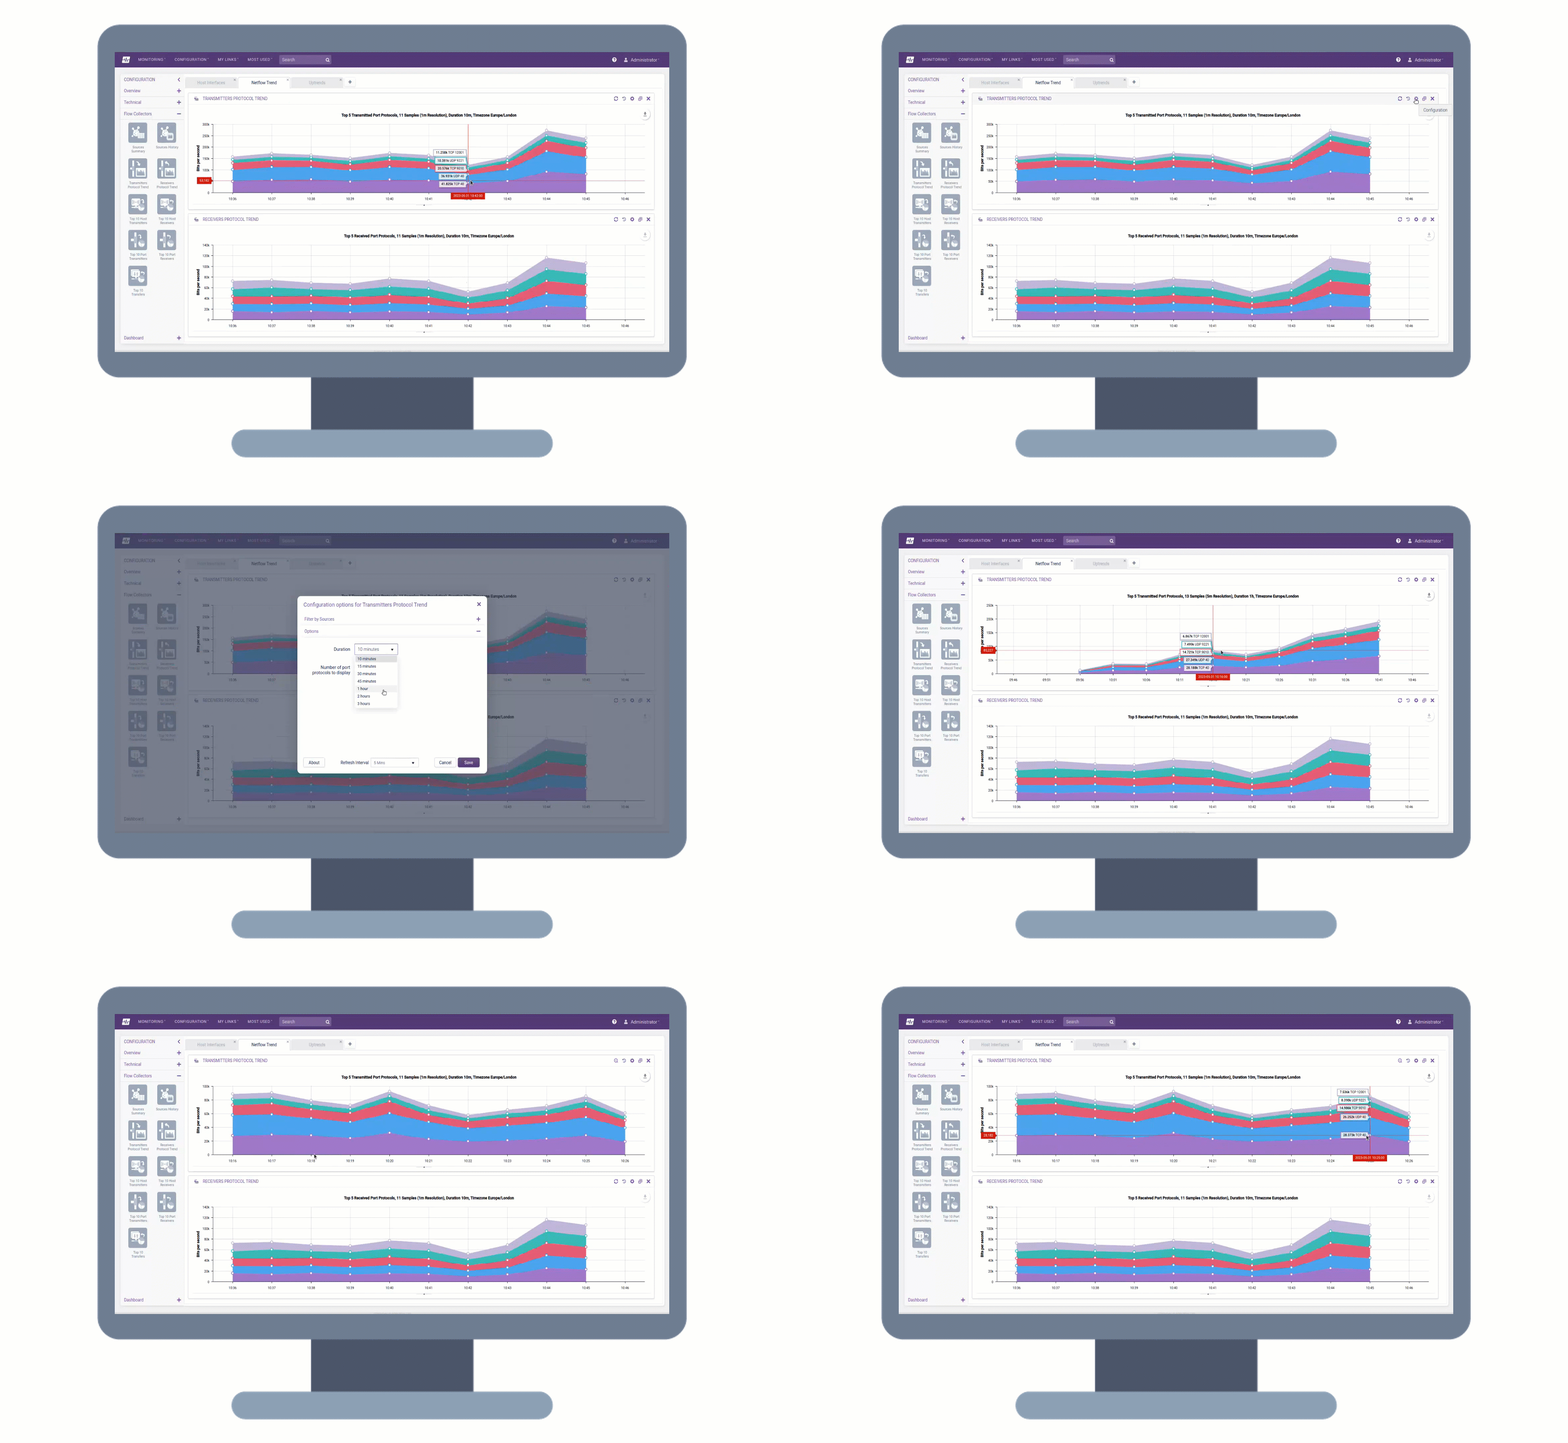
- Receivers Protocol Trend — display the top ports and protocols used to receive data, as recorded by the source device (such as a switch or firewall) that supports netflow and sflow.
- Transmitters Protocol Trend — display the top ports and protocols used to transmit data, as recorded by the source device (such as a switch or firewall) that supports netflow and sflow.
Added the ability to select historical time ranges to the following dashlets:
- Performance Graph
- Receivers Protocol Trend
- Transmitters Protocol Trend
Added a new Dashboard Time Range Sync mode to sychronise cursors and zooming across supported dashlets.
Jasper Server upgrade to 8.1.0
The Reports Module has been updated to use Jasper server 8.1.0 and Tomcat 9.0.65 which fixes a number of security vulnerabilities. UI and functionality remain the same, however note two new UI features:
- Favourite Report selector (home page)
- Schedule report button and shortcut (edit report view)
Flow Collector improvements
The opsview-flow-collector
has been made more resilient to any messagequeue
failures, so it now reconnects automatically.
A TTL (time to live) has been added to any flow requests made through the REST API, so messages are automatically removed if a flow-collector does not pick up the request within 30 seconds. This avoids a build up of messages if the component is temporarily stopped.
Additional timing data will be returned by Flow REST API calls, for debugging:
collector
— machine ref for the collector that has run this flow request.duration_total
— total time spent running the call on the remote collector.duration_nfdump
— time spent by the call running thenfdump
command.
Opsview 6.7.5
These are the highlights in this release:
-
Integrated with ITRS Uptrends .
-
Enhanced deployment to enable using sudo without the
NOPASSWD
option. -
Fixed an issue so re-notifications are now consistently sent following configuration changes.
-
Multiple security enhancements including:
- Improved security access related to view access for monitoring servers.
- Implemented a Content Security Policy.
- Removed the Opsview software version disclosure to unauthenticated users.
- Implemented a session timeout redirection to the login page.
Uptrends integration
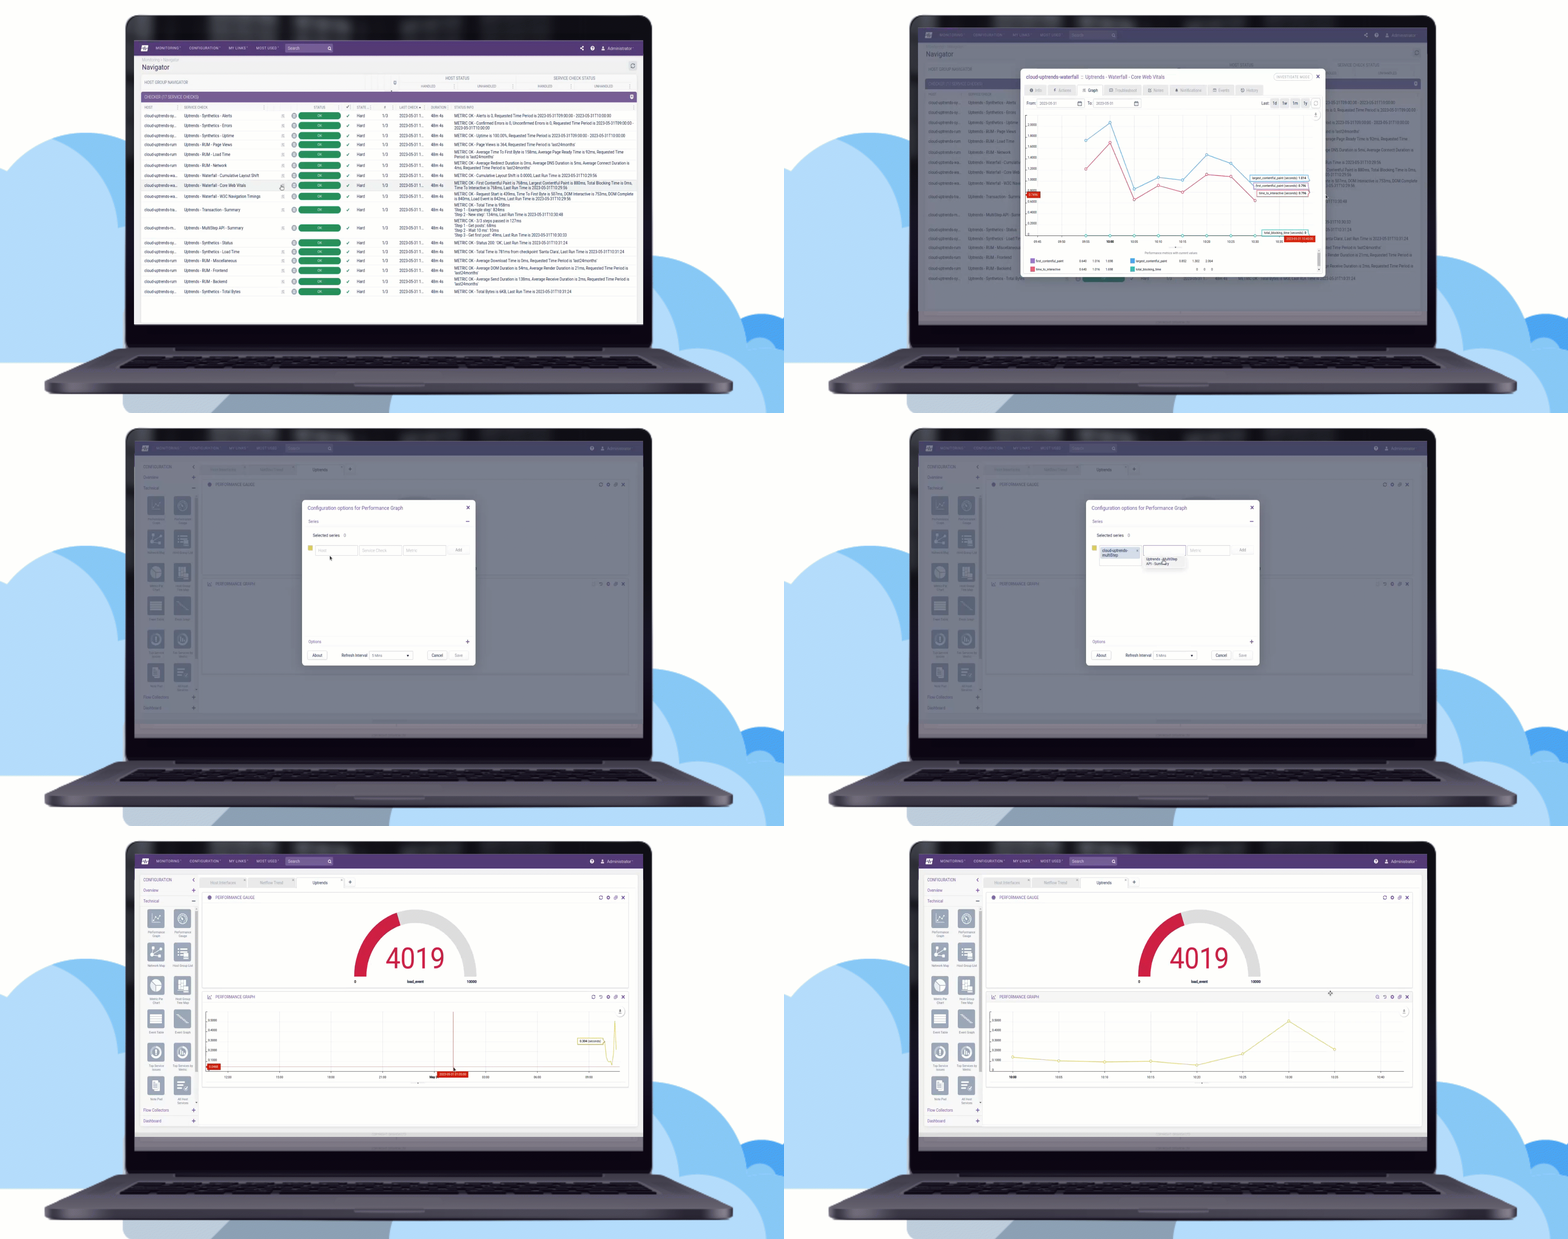
ITRS Uptrends is a leader in website monitoring, web application monitoring, and API monitoring. The new Cloud-Uptrends Opspack provides an integration to monitor your Uptrends monitors in Opsview.
The following host templates are provided as part of this Opspack:
- Cloud - Uptrends - Synthetics
- Cloud - Uptrends - MultiStep API
- Cloud - Uptrends - Transaction
- Cloud - Uptrends - Waterfall
- Cloud - Uptrends - RUM
Deploy updates
It is now possible to deploy Opsview to collectors using sudo without the NOPASSWD
option set. In this case the orchestrator will need to know the local password for this account, so it is advised to turn off remote password login for this account by adding the following to the sshd_config
on the collector.
Match User <local user for sudo>
PasswordAuthentication no
The following playbooks will now set up the appropriate version of Python on InfluxDB systems if configured, as the first action in a deployment:
check-deploy.yml
setup-hosts.yml
Re-notifications are now consistently sent following configuration changes
In previous versions of Opsview Monitor, re-notifications did not consistently take configuration changes into account if an object was in a non-OK state prior to the change. For example, adding a hashtag with notifications applied to a Service Check in a non-OK state will now correctly send all notifications.