Quick tour
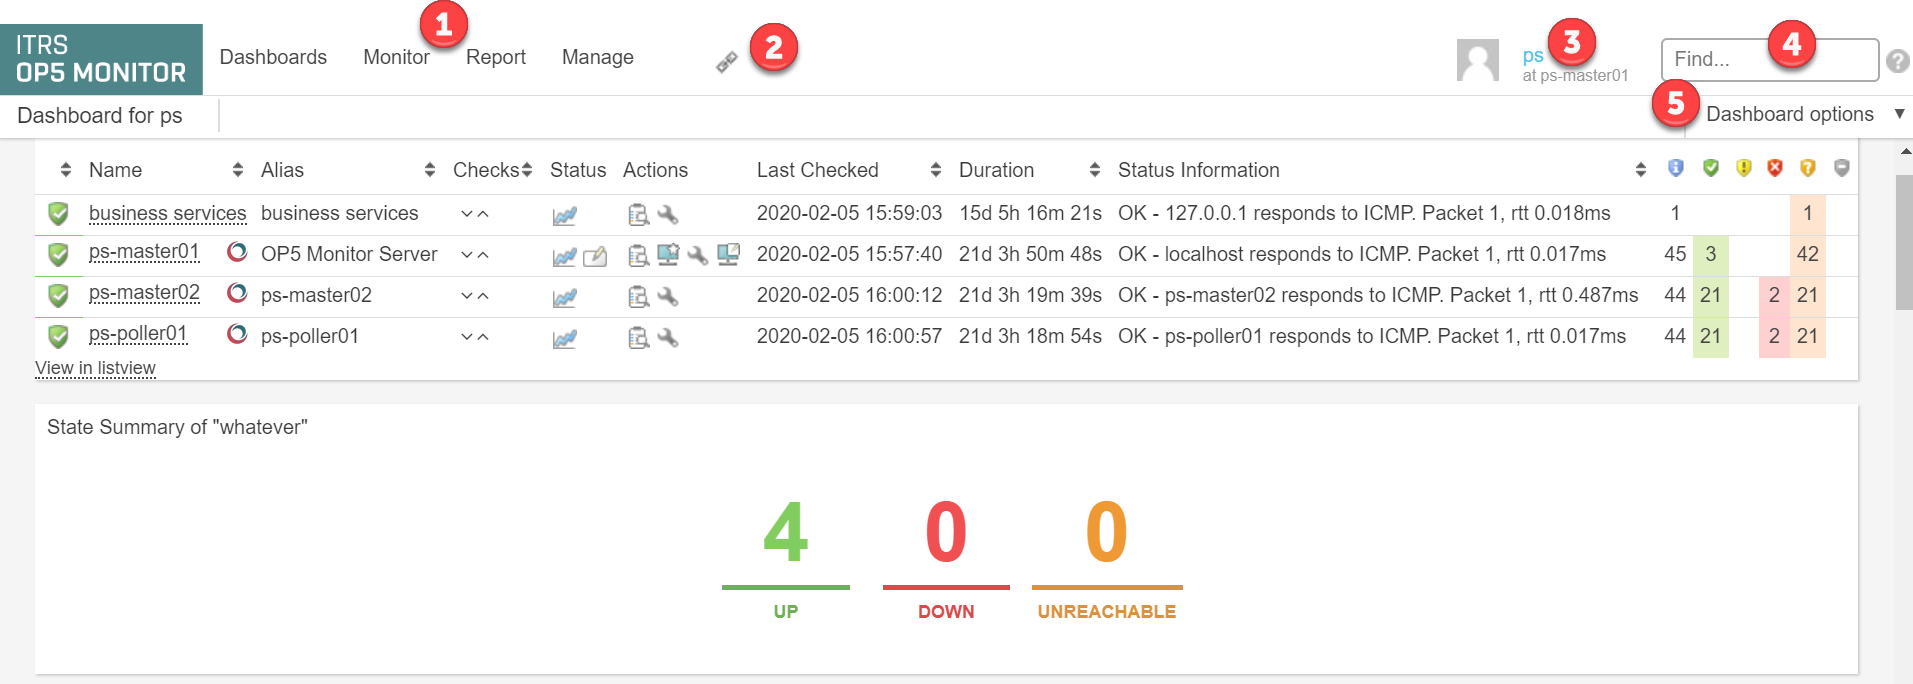
After you log in to OP5 Monitor, your default OP5 Monitor dashboard is displayed on your landing page:
| Number | Component | Description | More information |
|---|---|---|---|

|
Main navigation menus |
Dashboards: for creating and viewing dashboards Monitor: for accessing the main monitoring functions Report: for creating and viewing reports Manage: for configuring and managing monitoring data |
|

|
Quick links |
For adding shortcuts to frequently used reports and views to the menu bar |
Quick links |

|
User menu |
For customising your user profile and logging out |
Get started with OP5 Monitor |

|
Search bar | For searching for hosts and services and related information | Search field |

|
Dashboard options menu | For configuring your dashboard(s) | Customise your dashboard |
Key features
Some of the key features of the OP5 Monitor user interface are summarised below.
Dashboards
Dashboards display an overview of monitoring information on your OP5 Monitor landing page. Dashboards have the following characteristics:
- You can configure one or more dashboards for access from the Dashboards menu.
- Each dashboard can display different information based on widgets.
- Your landing page after login displays the dashboard you set as default.
- You can create dashboards for external use, such as on big screen displays.
For more information on basic and advanced dashboard configuration, see:
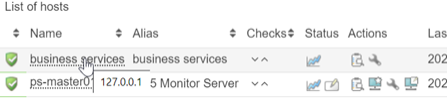
List views
List views are the basic component OP5 Monitor uses to display a list of objects with their status data. You can add them to dashboards using widgets, filter them, and customise them to display only the information you want to see.
For more information, see Configure list view columns.
Filters
You can filter any OP5 Monitor list views and create new views to add to the Monitor menu which display only the items that correspond to specific criteria, such as lists of hosts in a particular status or particular types of log messages.
For more information, see Manage list view filters.
Quick links
Quick links are shortcuts you create in a custom navigation bar to access your most frequently used views and reports.
For more information, see Customise your quick links bar in Customise your user interface.
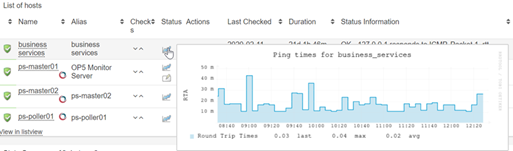
Quick access menu
You can quickly access the most important functions for hosts and services by opening the quick access menu in a list view.
For more information, see Quick access in Introduction to monitoring hosts, services, and groups.
Multiple action menu
You can use the multiple action menu to perform an action on multiple items in a list view.
For more information, see Multiple actions in Introduction to monitoring hosts, services, and groups.
Search field
OP5 Monitor comes with a search facility, for searching for hosts and services and related information. You can perform a simple search, using just a string, or an advanced search, using parameters and combined criteria.
For more information, see Search facility in Introduction to monitoring hosts, services, and groups.