Overview
Histogram reports show a graphical view of trends on an object.
You create histogram reports using menu entry Report > Histogram > Create Histogram Report.
Create a histogram report
To create a histogram report:
- Select the monitoring object from the Report type drop-down list.
- Choose the objects to show in the report.
- Select the report settings, as described in the table below.
Option Description Reporting period The period of the report. If you select Custom, enter the start and end year and month. Statistics breakdown Whether to show hourly or monthly statistics, or by day of the month or week. State types Whether to show hard state types, soft state types, or both. Events to graph States to include in the report. Ignore repeated states Whether to exclude repetitions. Time zone Time zone to use for the report. Skin The skin to use. This affects the visual elements of the report, and is used in both HTML and PDF reports. Description The description to include in the report header. - Click Show report.
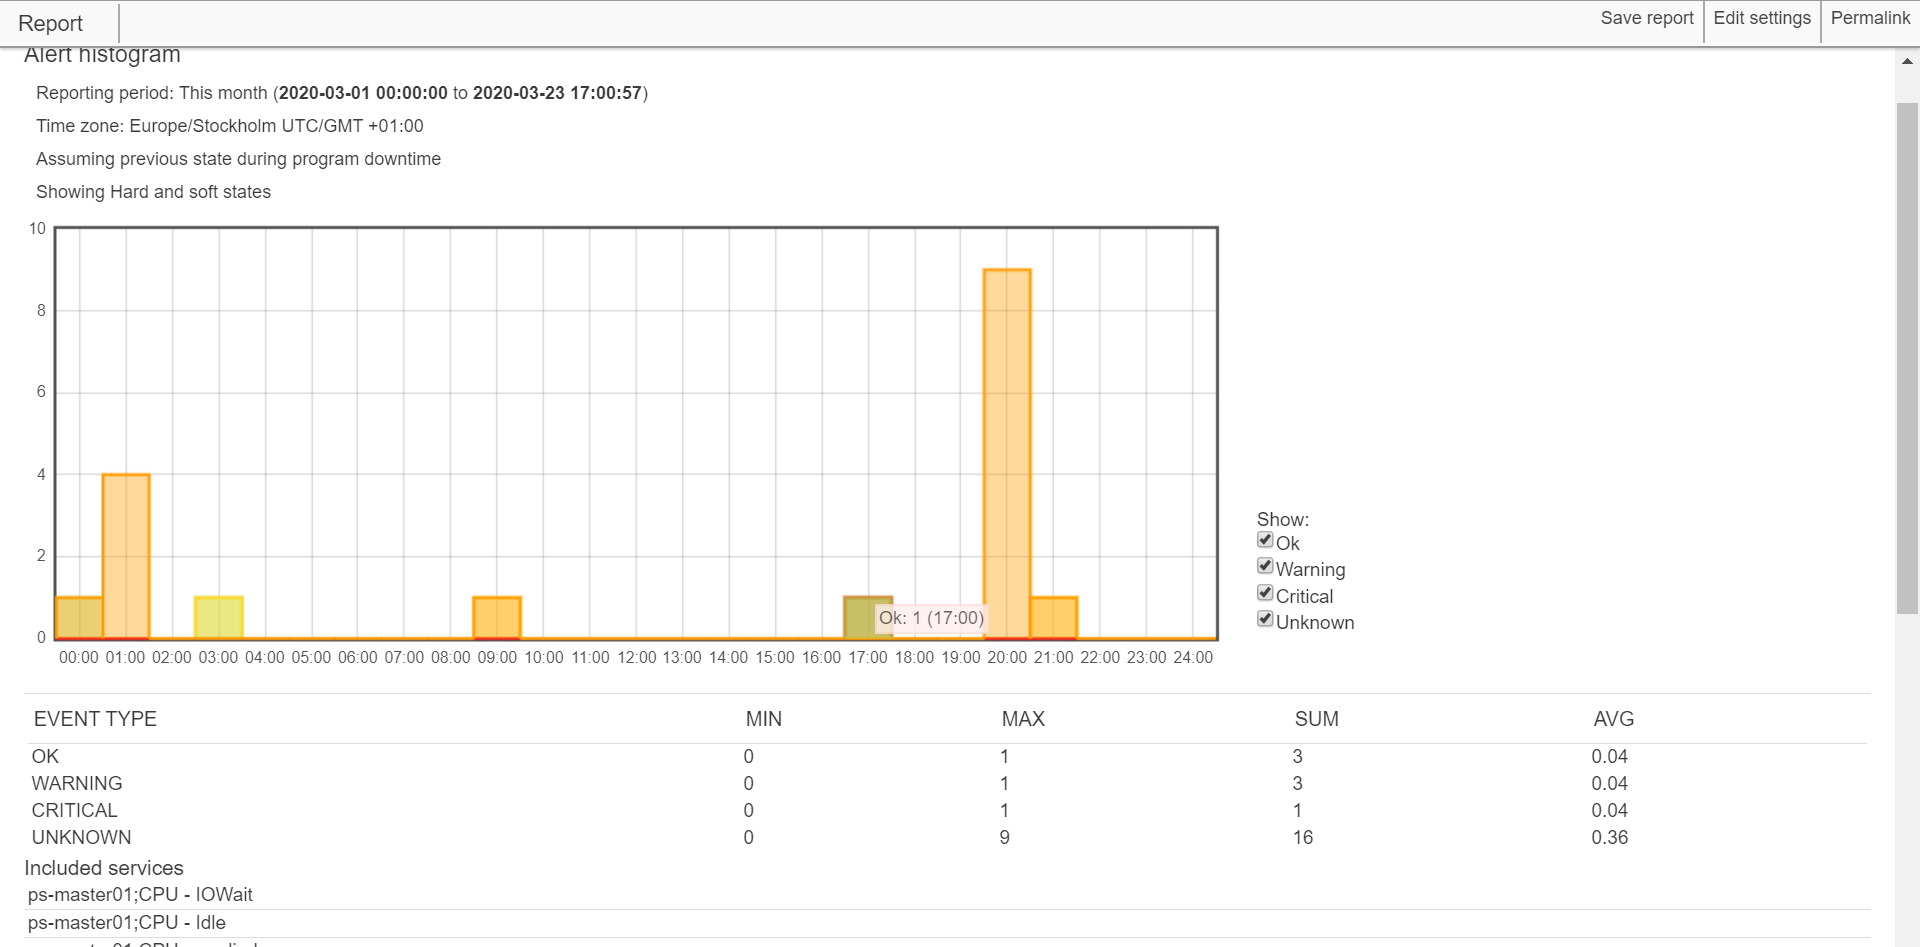
The histogram report
The histogram report displays the object states over time.
You can perform any of the general report functions from the report, such as save, edit, and export the report. For guidance, see Reports in Introduction to reporting.