Install and set up template
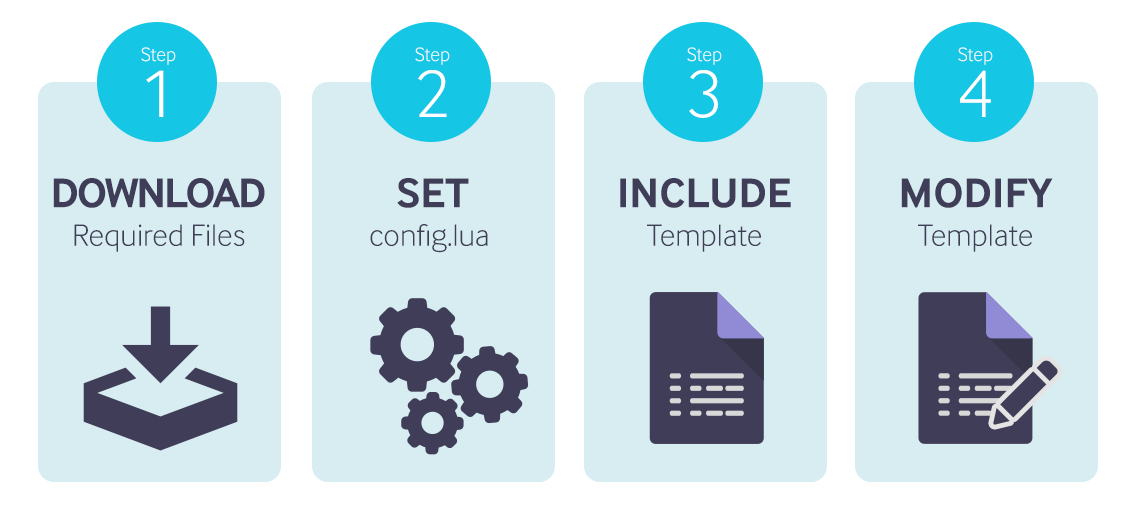
Download files
For the MDM templates to work, you must download the following:
Note: The location of the configuration file and the Lua scripts should be accessible to the Netprobe.
Set up config.lua
The config.lua file contains all
client-specific infrastructure details such as target
machines, log-in credentials, and feed-specific
information. This file needs to be modified depending on
client infrastructure and monitoring needs.
Modify market data feed parameters
All market data feed adapters are configured within
config.lua.
Please note that the configurations differ, are particular to the supplier, and should be modified with reference to what the subscription to the feed will permit.
The feed adapter configurations follow a similar pattern:
| Key | Value |
|---|---|
| feed | type = <type of adapter> (e.g. bloomberg) library.filename = library file (e.g. geneos-feed-bloomberg.so) |
| <type of adapter> | parameters that are required by the feed adapter, generally connection data |
| instruments | a table mapping of user-defined instrument names to the instrument name within the feed |
| fields | the fields that should be collated by the adapter |
Note: The libraries contain the routines that connect to the actual data feed and are all distributed with the Netprobe distribution package.
IX servers: <netprobe>/flm
IX libraries:
- flm-feed-example.so
- flm-feed-gl.so
- flm-feed-nyxt.so
- flm-feed-rfa.so
- geneos-feed-bloomberg.so
- geneos-feed-exegy
- geneos-feed-lua.so
- geneos-feed-quant.so
Windows libraries:
- flm-feed-example.dll
- flm-feed-gl.dll
- flm-feed-rfa.dll
- flm-feed-tt.dll
- geneos-feed-bloomberg.dll
- geneos-feed-lua.dll
Modify path variables
In addition to modifications for the particular market data feed parameters, the following variables also require adaption :
| Variable | Value to set |
|---|---|
| m.libpath | The path to the library files (e.g. path to
geneos-feed-bloomberg.so). |
| m.rfapath | The path to the RFA configuration file (e.g.
path to rfa_omm.cfg). |
Include template
The MDM_Template.xml should be included in
Gateway's configuration. Please refer to Gateway Setup
Editor's documentation on how you can add and load
'Include' files.
Modify template
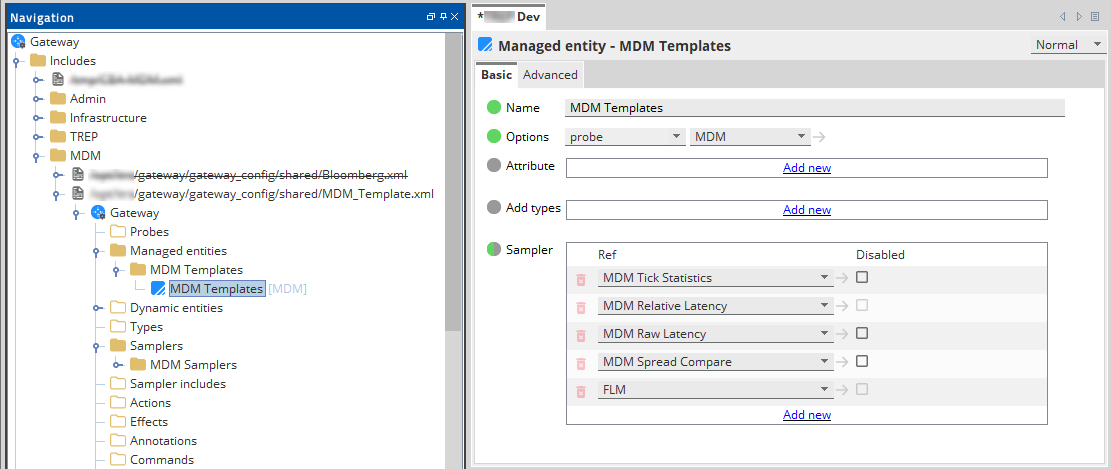
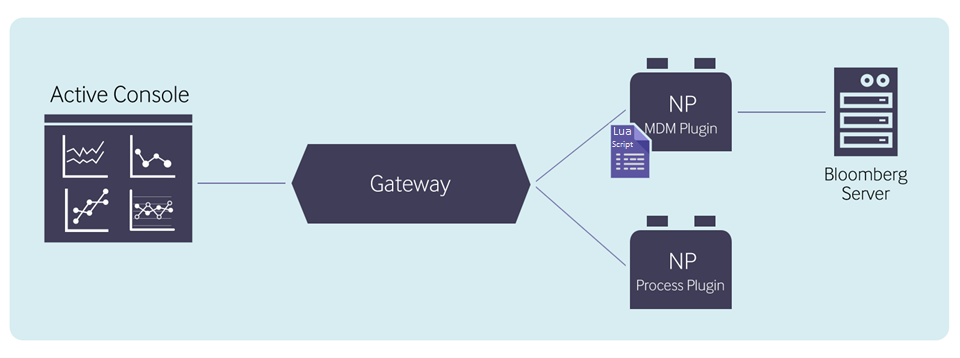
The include file (MDM_Template.xml) contains one Managed
Entity group ("MDM") with one Managed Entity ("MDM
Template") that has five templated samplers.
Attach "MDM Template" Managed Entity to a probe
The managed entity "MDM Template" is contained in the managed entity group "MDM" and should be attached to the appropriate Netprobe that will subscribe to the market data feeds.
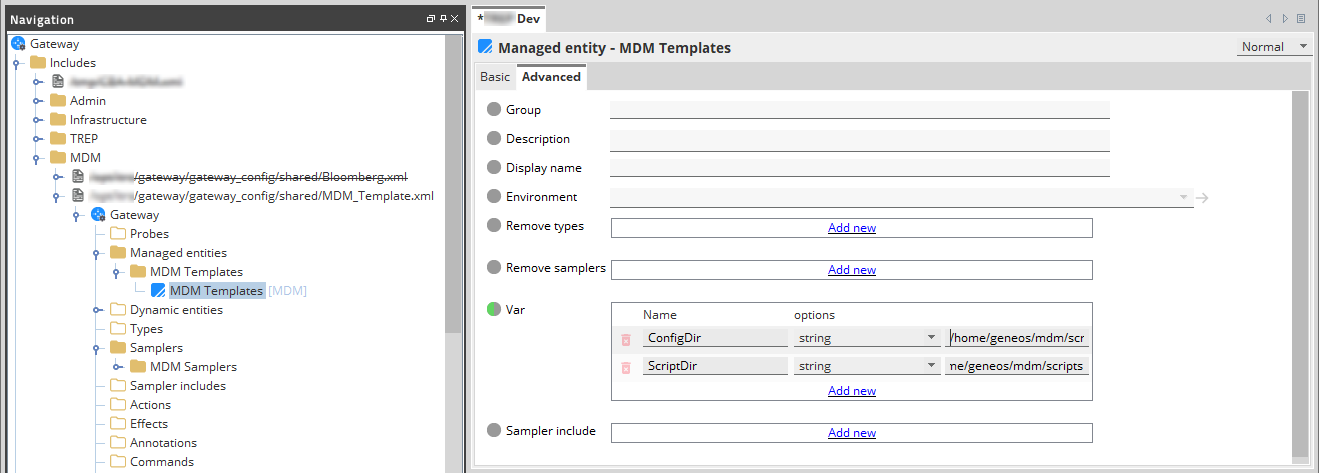
Modify the ScriptDir and ConfigDir variables in "MDM Template" Managed Entity
The variables ScriptDir and ConfigDir are defined in the advanced tab of the "MDM Templates" managed entity group and should be set as follows.
| Variable | Value to set |
|---|---|
| ScriptDir | The path of the downloaded Lua script files. |
| ConfigDir | The path of the downloaded Lua configuration file
(config.lua). |
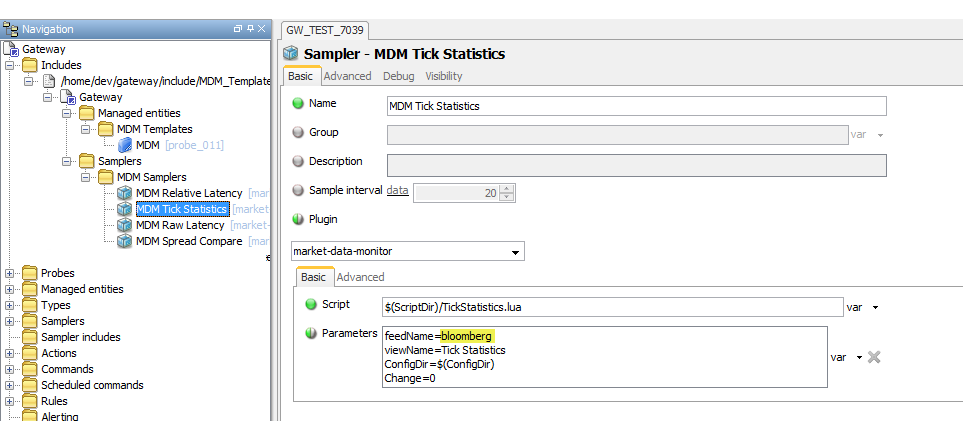
Modify the sampler templates
Any of the following feedName parameters of each template
sampler must be set to the name of the data feed, as
found in the config.lua.
- feedName
- baseFeedName
- altFeedName
- topSPSFeedName
- providerSPSFeedName
- subproviderSPSFeedName
Possible values:
- feedName=bloomberg
(serverHost = bpipeserv01.ldn, serverPort = 8194, applicationName = market-data-monitor)
- feedName=exegy
(serverHost = 192.168.2.1, username = test, password = test)
- feedName=gl
(p3host = 192.168.111.111, p3port = 11111, slcNode = 1000)
- feedName=lua
(script = path/to/script.lua, extraParam = "", otherParam = "")
- feedName=nyxt
(middleware = wmw, transport = wmw_tport, dictionary.download = true)
- feedName=quant
(serverHost = 84.111.111.111, serverPort = 6041, username = demo, password = myPassword, applicationName = market-data-monitor)
- feedName=rfa
(configFile = rfa_omm.cfg, session = sessionrh1_omm, connectionType = OMM)
- feedName=rfa_001
(configFile = rfa_omm.cfg, session = sessionrh2_omm, connectionType = OMM)
- feedName=tradetech
(exchange = EUREX, global.universal.username = myUser, global.universal.password = myPassword, global.universal.encoding = plaintext)
feedName=Tutorial
Please refer to each templated sampler's documentation for more sampler parameters that can be modified.
MDM Samplers
MDM Tick Statistics
The MDM Tick Statistics sampler illustrates the ability to compute statistical values on data derived from individual instrument ticks.
Dataview
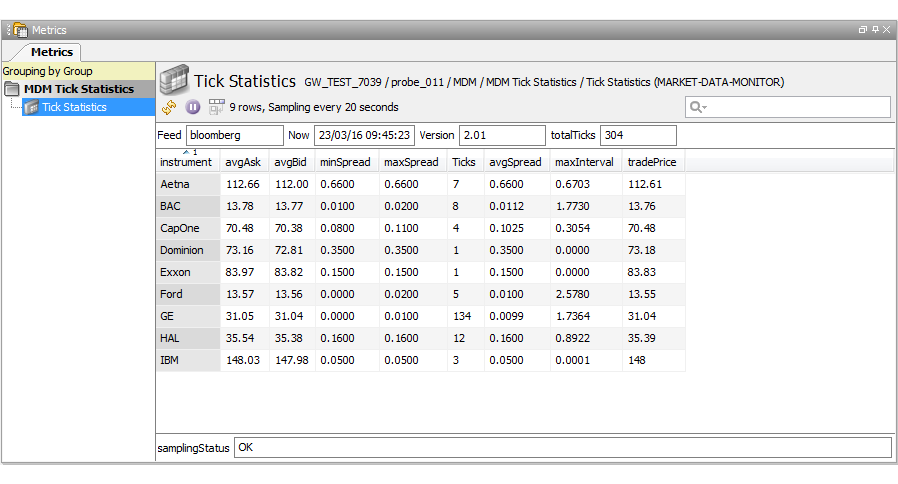
The dataview headlines are:
| Headline | Description |
|---|---|
| Feed | Name of the data feed, as found in the config file. |
| Now | The calendar time of the sample. |
| Version | The version and revision of the running script. |
| totalTicks | The total number of ticks. |
The dataview row columns are:
| Column | Description |
|---|---|
| instrument | The short form name of the requested instrument. |
| avgAsk | The average ASK price over the number of ticks received during the sampling interval. |
| avgBid | The average BID price over the number of ticks received during the sampling interval. |
| minSpread | The minimum (ASK - BID) value over the sampling interval. |
| maxSpread | The maximum (ASK - BID) value over the sampling interval. |
| Ticks | The number of ticks processed during the sampling interval. |
| avgSpread | The average spread value. |
| maxInterval | The maximum time between the first tick and the last tick during the sampling interval. |
| tradePrice | The instruments trade price as found in the last tick during the sampling interval. |
Commands
The following command is available by right-clicking when the mouse is over the appropriate area:
| Command | Area | Function |
|---|---|---|
| Reset Tick Count | totalTicks Headline | To reset the total tick count to zero. |
Sampler configuration
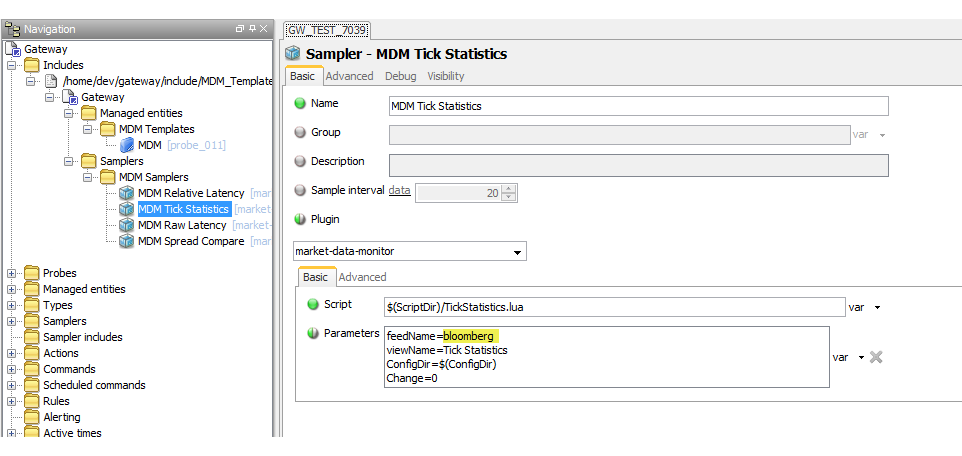
The sampler can contain the following parameters:
| Parameter | Description |
|---|---|
| feedName | The name of the data feed, as found in
config.lua. |
| viewName | The name of the dataview. |
| ConfigDir | The location of the configuration file (not actually required). |
| Change | If this is modified, the sampler can be restarted in isolation to the other samplers. |
MDM Spread Compare
The MDM Spread Compare sampler illustrates the ability to capture summary ticks of multiple instruments from multiple market data feeds whilst computing statistical information.
Dataview
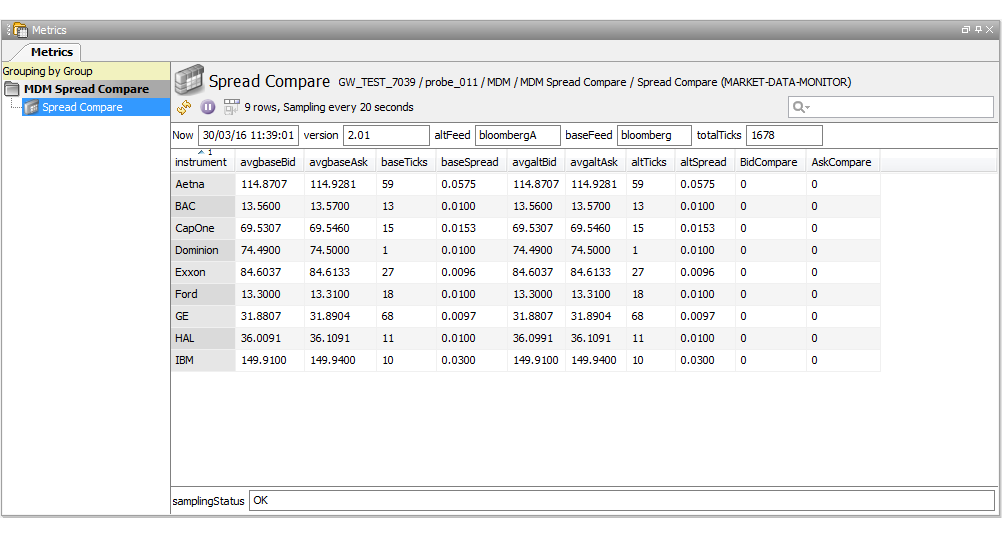
The dataview headlines are:
| Headline | Description |
|---|---|
| Now | The calendar time of the sample. |
| Version | The version and revision of the running script. |
| altFeed | The name of the secondary data feed, as found in the config file. |
| baseFeed | The name of the primary data feed, as found in the config file. |
| totalTicks | The total number of ticks. |
The dataview row columns are:
| Column | Description |
|---|---|
| instrument | The short form name of the requested instrument. |
| avgbaseBid | The average BID price seen by the base feed during the sampling interval. |
| avgbaseAsk | The average ASK price seen by the base feed during the sampling interval. |
| baseTicks | The number of instrument ticks seen by the base feed during the sampling period. |
| baseSpread | The average difference between ASK and BID (ASK - BID) seen by then base feed during the sampling interval. |
| avgaltBid | The average BID price seen by the alternate feed during the sampling interval. |
| avgaltAsk | The average ASK price seen by the alternate feed during the sampling interval. |
| altTicks | The number of instrument ticks seen by the alternate feed during the sampling period. |
| altSpread | The average difference between ASK and BID (ASK - BID) seen by then base feed during the sampling interval. |
| BidCompare | The difference between the base average BID and the alternate average BID during the sampling interval. |
| AskCompare | The difference between the base average ASK and the alternate average ASK during the sampling interval. |
Commands
The following command is available by right-clicking when the mouse is over the appropriate area:
| Command | Area | Function |
|---|---|---|
| Reset Tick Count | totalTicks Headline | To reset the total tick count to zero. |
Sampler Configuration
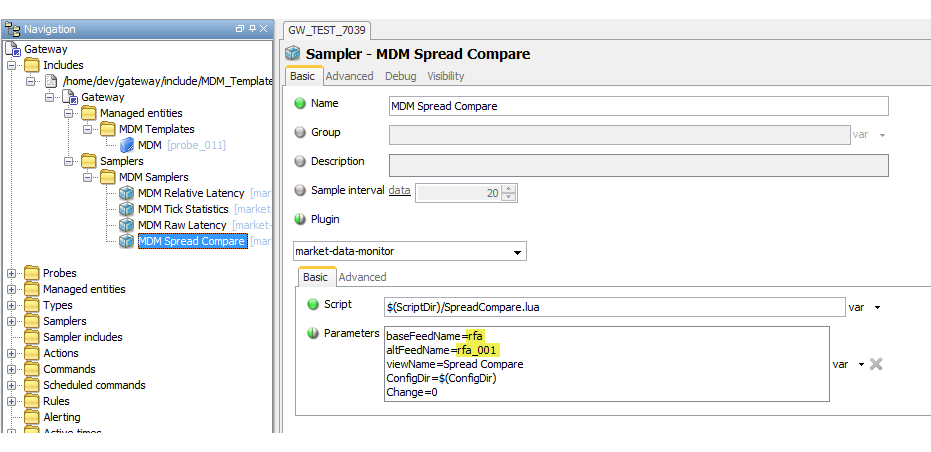
The sampler can contain the following parameters:
| Parameter | Description |
|---|---|
| baseFeedName | The name of the primary data feed, as found in
config.lua. |
| altfeedName | The name of the secondary data feed, as found in
config.lua. |
| viewName | The name of the dataview. |
| ConfigDir | The location of the configuration file (not actually required). |
| Change | If this is modified, the sampler can be restarted in isolation to the other samplers. |
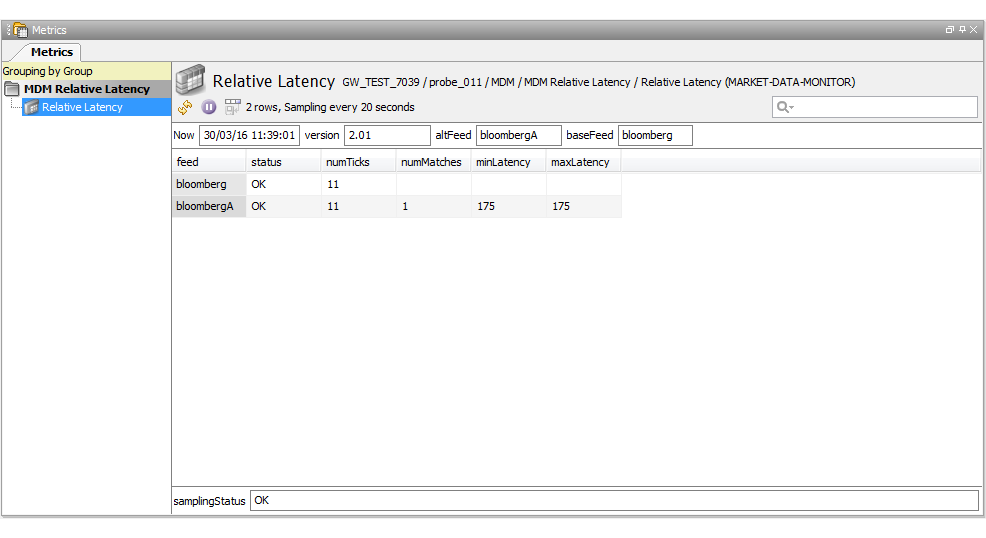
MDM Relative Latency
The MDM Relative Latency sampler illustrates the ability to capture individual ticks from multiple market data feeds. The latency figures displayed are the time difference between the matching instrument tick timestamps. The sampler is a simplistic tick timestamp compare, wherein the functionality is better performed with the Geneos FLM plug-in which has many added features. The base feed will have no latency figures. The latency figures are calculated within the Netprobe code and not within the Lua script.
Dataview
The dataview headlines are:
| Headline | Description |
|---|---|
| Now | The calendar time of the sample. |
| Version | The version and revision of the running script. |
| altFeed | The name of the secondary data feed, as found in the config file. |
| baseFeed | The name of the primary data feed, as found in the config file. |
The dataview row columns are:
| Column | Description |
|---|---|
| feed | The short form name of the selected market data feed. |
| status | The sample time status of the feed. |
| numTicks | The number of ticks received during the sampling interval. |
| numMatches | The number of matched instrument ticks received within the sampling interval. |
| minLatency | The minimum time difference between the matching ticks. |
| maxLatency | The maximum time difference between the matching ticks. |
Commands
None
Sampler Configuration
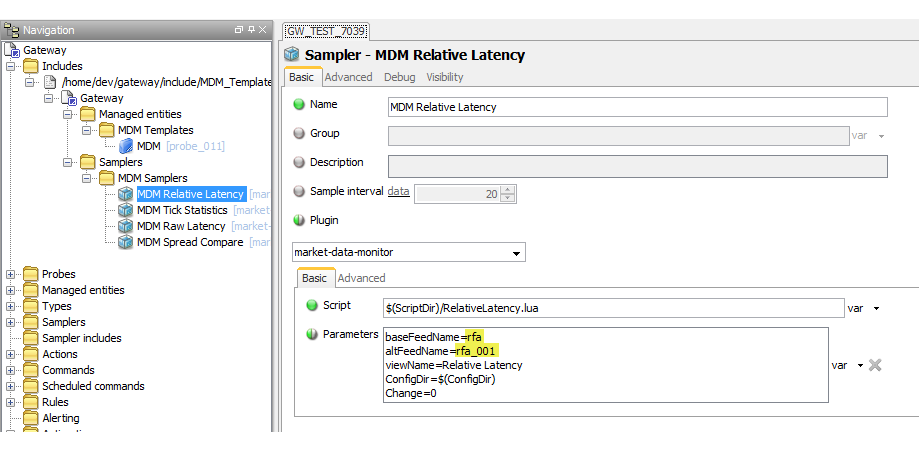
The sampler can contain the following parameters:
| Parameter | Description |
|---|---|
| basefeedName | The name of the primary data feed, as found in
config.lua. |
| altfeedName | The name of the secondary data feed, as found in
config.lua. |
| viewName | The name of the dataview. |
| ConfigDir | The location of the configuration file (not actually required). |
| Change | If this is modified, the sampler can be restarted in isolation to the other samplers. |
Note: If the script detects that the base and alternate feed names are identical, it will add the character "A" to the alternate feed name.
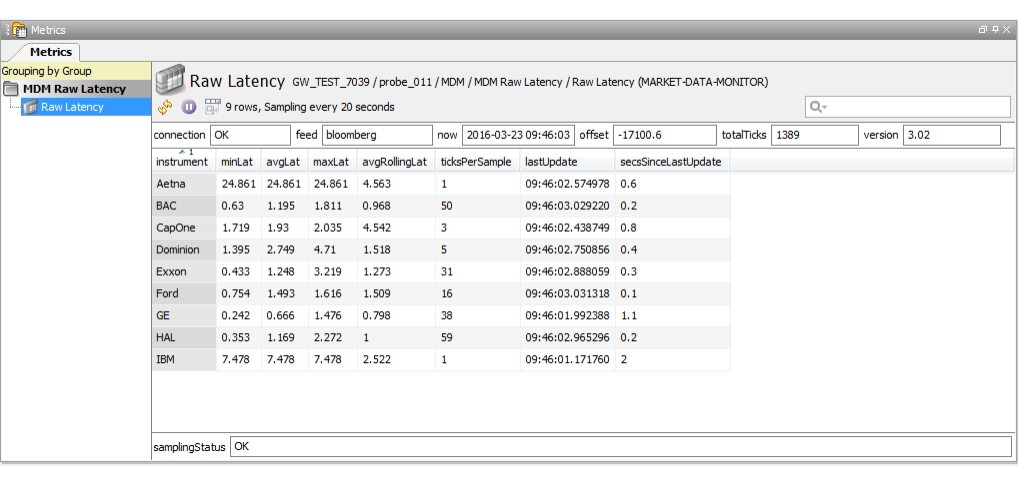
MDM Raw Latency
The MDM Raw Latency sampler illustrates the ability to capture summary information about market data ticks. The latency figures displayed are the time difference between the tick timestamp and the actual Netprobe time when the tick is seen.
Dataview
The dataview headlines are:
| Headline | Description |
|---|---|
| connection | Status of the feed. |
| feed | The name of the data feed, as found in the config file. |
| now | The calendar time of the sample. |
| offset | The time offset to apply to the srcTime. |
| totalTicks | The total number of ticks. |
| version | The version and revision of the running script. |
The dataview row columns are:
| Column | Description |
|---|---|
| instrument | The short form name of the selected instrument. The instrument will need to be available from the selected market data feed provider. |
| minLat | The minimum latency time (difference between the tick's srcTime and the Netprobe's system time) over the number of ticks received during the sampling interval. |
| avgLat | The average latency time over the number of ticks received during the sampling interval. |
| maxLat | The maximum latency time over the number of ticks received during the sampling interval. |
| avgRollingLat | The rolling average latency time over the number of ticks received during the sampling interval. |
| ticksPerSample | The number of ticks received for this instrument during the sampling interval. |
| lastUpdate | The last tick timestamp. |
| secsSinceLastUpdate | The number of seconds since the last tick update. |
Commands
None
Sampler Configuration
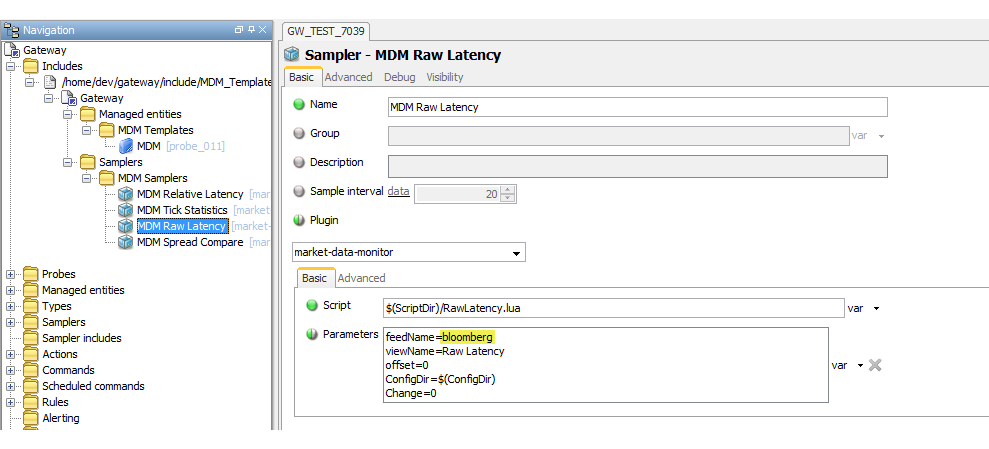
The sampler can contain the following parameters:
| Parameter | Description |
|---|---|
| feedName | The name of the data feed, as found in
config.lua. |
| viewName | The name of the dataview. |
| offset | Offset to be applied to the latency value to normalise. |
| ConfigDir | The location of the configuration file (not actually required). |
| Change | If this is modified, the sampler can be restarted in isolation to the other samplers. |
Test performance
This test shows the impact of running one of the MDM plugin templates (MDM Tick Statistics) on a machine's CPU and Memory.
The MDM plugin used in this testing was connected to a Bloomberg appliance server and ran for almost 13 hours (2:00pm-3:00am PHT or 7:00am-8:00pm London, UK Time). It subscribed to 1,578 instruments with four fields, namely: BID, ASK, LAST_PRICE, LAST_PRICE_TIME_TODAY_REALTIME.
It used the TickStatistics script from the MDM Templates that computed for the following statistical data derived from individual instrument ticks received from the Bloomberg appliance server:
- Average ASK per sample
- Average BID per sample
- Minimum, maximum and average spread per sample
- Maximum interval between ticks
- Total number of ticks
- Last trade price
Aside from testing using the Bloomberg feed, additional tests were conducted using the MDM Feed Adapter Simulator (Example Feed Adapter) because results from the above configuration are sometimes inaccurate (unpredictable number of updates/data for each instrument) and are insufficient (the maximum amount of data updates/data is only 1835). We needed more data to make a more accurate conclusion. Thus, more tests were conducted using the Simulator. The said simulator helped us control the amount of updates/data being published to the Netprobe which resulted in a more accurate and wider range of data.
Configuration
The table below shows the summary of the test environment.
| Test Environment | Value |
|---|---|
| GSE Setup | MDM Templates
setup with all except MDM tick
Statistics sampler are disabled.
|
| MDM Tick Statistics Sampling Interval | Default (20 seconds) |
| Lua Script | |
| m.Bloomberg = {
feed = {
type = "Bloomberg",
[ "library.filename" ] = m.libpath .. "geneos-feed-Bloomberg" .. m.libext,
[ "library.skipVersionCheck" ] = "false",
[ "library.debug.load" ] = "true",
verbose = "true"
},
Bloomberg = {
serverHost = "192.168.10.173",
serverPort = "8194",
applicationName = "ITRS:app_name",
},
instruments = {...}, -- 1,578 instruments
fields = {
Bid = "BID",
Ask = "ASK",
Trade = "LAST_PRICE",
SrcTime = "LAST_PRICE_TIME_TODAY_REALTIME"
}
} |
| Feed Adapter Configuration(Example feed) | m.example = {
feed = {
type = "example",
[ "library.filename" ] = m.libpath .. "flm-feed-example" .. m.libext,
[ "library.skipVersionCheck" ] = "true",
[ "library.debug.load" ] = "false",
verbose = "true"
},
example = {
publishingPeriod=20, -- changes depending on the target tick count
},
instruments = {...}, -- either 100 or 500 instruments
fields = {
Bid = "BID",
Ask = "ASK",
Trade = "LAST_PRICE",
SrcTime = "LAST_PRICE_TIME_TODAY_REALTIME"
}
}
|
| No. of Subscribed Instruments | 1,578 instruments (11 currency & 1567 LN equity) |
| No. of Subscribed Fields | 4 fields |
| Processes plugin Sampling Interval | 1 second |
| Netprobe version | Netprobe.linux_64.GA3.5.0-160310 |
| Machine |
|
| Time of testing | 13 hours (2:00pm-3:00am PHT or 7:00am-8:00pm London, UK Time) |
Data Gathering
The CPU and Memory usage data was gathered by running another Netprobe alongside the MDM-plugin-configured-Netprobe. This additional Netprobe was configured to monitor the CPU usage (PCPU) and virtual Memory size (Vsz) of the original Netprobe by using a Processes plugin with 1 second sampling interval.
The TickStatistics.lua script was also modified to display (via a dataview headline) the total number of ticks processed per sample.
The CPU usage, Memory usage and amount of ticks processed in Lua data were stored and monitored using charts in Active Console while the amount of received updates/data from the server was recorded in the logs of the Netprobe.
Data Analysis
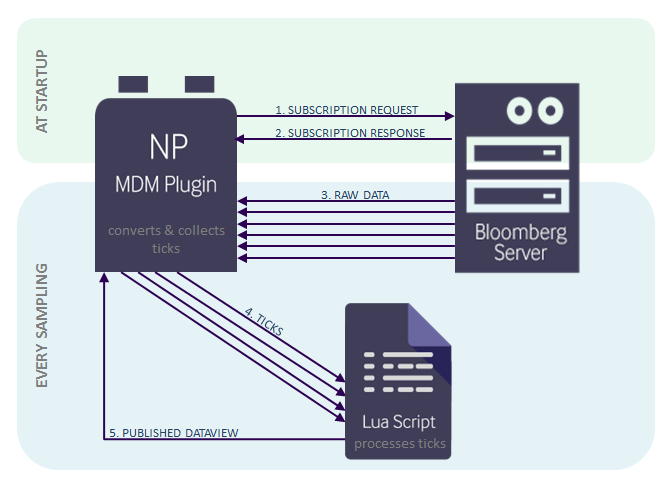
In this test, we focused on monitoring the CPU/Memory usage of the following three main processes (one during startup and two every sampling):
- Instrument subscription (at startup only) – this
refers to the process of subscribing each instrument
stated in the config file (
config.lua) to Bloomberg appliance server. First, the Netprobe starts a session with the Bloomberg appliance server. Then, it sends a subscription request and waits for a subscription response for each instrument. - Data collection (per sampling) – this refers to the process wherein Netprobe converts the data it receives from the Bloomberg appliance server into Lua-readable ticks which are then collected for the Lua Script Execution.
- Lua Script Execution(per sampling) – this refers to the process at the end of every sampling wherein the doSample function of the Lua script is executed. In this function, all collected ticks from the Netrpobe are processed to create a dataview which will then be published back to the Netprobe.
Results
Instrument Subscription
Instrument subscription is done at startup for each instrument listed in the feed adapter configuration. Netprobe first sends subscription request for each instrument to the server and then waits for all the subscription responses from the server. Once a subscription response is received for an instrument, that instrument is now considered to be subscribed. It can now start receiving data/updates from the server.
The graphs below show the impact of MDM's instrument subscription on CPU and Memory. The test duration for monitoring the CPU and Memory usages of the instrument subscription process is from Netprobe's startup until the reception of the last subscription response(meaning until all the instruments are already subscribed). The maximum CPU and Memory usage within that duration were used to create the graphs below. The time it took to process all the instrument subscriptions was plotted.
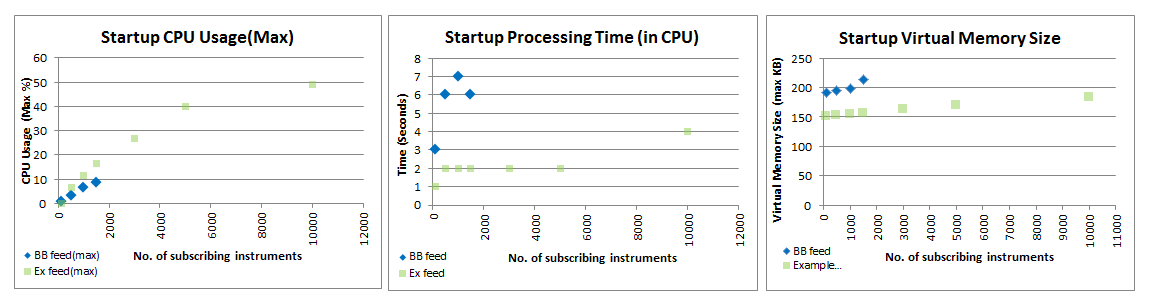
We can see that the CPU and Memory usage and Processing Time increased as the number of subscribing instruments increased. The Feed Simulator data can be used to estimate the CPU and Memory utilization impact of using an MDM-plugin (using a Bloomberg feed) with greater number of instruments. For example, if we have 10,000 instruments, it may consume a max of 50% of the CPU for 4 seconds and 183.54KB of the Memory.
Data Collection
Data collection is the process of receiving updates/data from the server and converting it to Lua-readable ticks. These ticks are collected until the end of every sampling interval (in this case 20 seconds) wherein these collected ticks are passed to Lua for the script execution(doSample()). Data Collection is done continuously for all the subscribed instruments.
The graphs below show the impact of Data Collection on CPU Utilization. The data received per second is plotted against its CPU percent usage. For Bloomberg feed, the data collected are for a random number of instruments wherein an instrument may have more/less updates than the other instruments. For example, for the 1500 column, some instruments received 100 updates, some 300, some 5 and some had no updates. On the contrary, Feed Simulator was configured to receive almost equal updates for all the instruments set in the configuration file (this was set to 100 or 500). For example, for the 1500 column, 15 updates were received for each of the 100 instruments (3 updates each for 500 instruments).
For the Feed Simulator, the tests were done twice, one with 100 instruments and another with 500 instruments. This will help us conclude if the number of instruments receiving updates has an impact on CPU utilization.
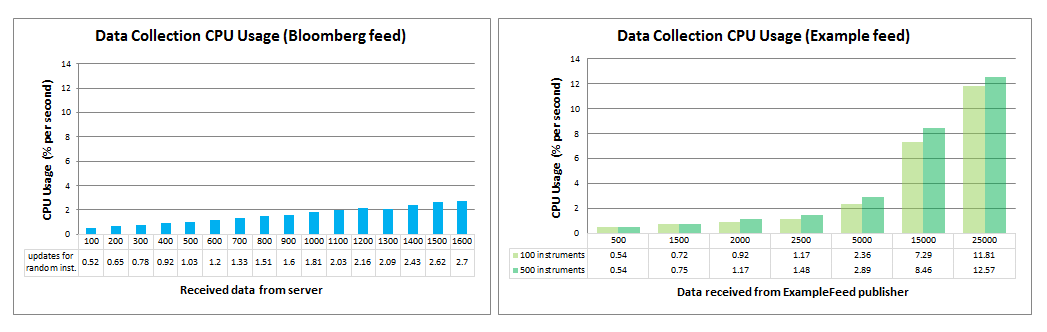
These graphs show that the CPU utilization is almost directly proportional to the amount of data received. Hence, the CPU utilization increased with the number of data received.
Also, the number of instruments receiving updates also had an impact on CPU utilization. The greater the number of instruments receiving updates, the more CPU was used. For example, if we look at the 5th column of the Feed Simulator graph where the total received updates in one second was 5000. When these 5000 updates were received for 100 instruments(50 updates each instrument), the CPU usage was only 2.36%. However, when received for 500 instruments(10 updates each instrument), the CPU usage increased to 2.89%.
By using the data above, we can say that an MDM-plugin with Bloomberg feed that receives 25,000 updates per second may consume a little over 13% of the CPU.
Lua Script Execution (doSample() function)
The Lua Script Execution refers to every process done inside the doSample() function of the Lua script. The doSample() function of the TickStatistics scripts gets all the collected ticks and processes each tick for each instrument. After processing all the ticks for all the instruments, it will then create and publish a Dataview.
The graph below shows the impact of Lua Script Execution on CPU and Memory utilization. The total number of ticks processed in the Lua script is plotted against its CPU percent usage and Virtual Memory Size. Similar to earlier tests done using the Feed simulator, two instrument configurations were tested: 100 instruments & 500 instruments.
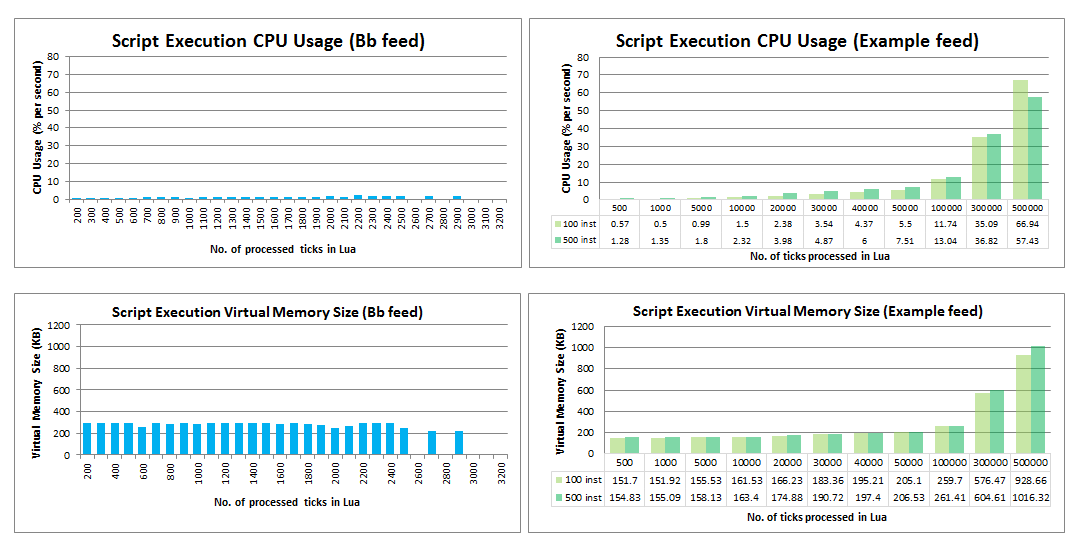
Similar to the previous graphs, these show that the CPU utilization percentage is also directly proportional to the number of ticks processed. The CPU utilization increased as the number of processed ticks increased. However, the CPU usage in Lua script execution was much higher than the CPU usage in Data Collection process. 300,000 ticks can be processed in Lua with more or less 36% CPU usage and 600KB virtual Memory Size. This is because the Lua script performs calculations (like getting the average,max & min,rounding off, and more) for each tick of each instrument.
The number of instruments also had an impact on the CPU and Memory usage. Up until 300,000 processed ticks, the CPU and Memory usage of the configuration with 500 instruments was higher than that of 100 instruments. At 500,000 processed ticks, the CPU usage of the configuration with 100 instruments (66.94%) became higher than the CPU usage of the configuration with 500 instruments (57.43%). Therefore, if the user is expecting 500,000 or more ticks to be processed per sample, it is better to divide the instruments into two or more feeds.
Conclusion
To conclude, all of the following have impact on CPU and Memory usage of an MDM-plugin-configured-Netprobe.
- The number of instruments configured in the feed adapter configuration (in config.lua) — the more instruments there are, the more CPU and Memory are used in the Startup/Instrument Subscription process. The instrument count also has a minimal effect on the Data Collection and Script execution processes.
- The amount of data collected — the more updates/data received from the server, the more CPU is consumed.
- The amount of ticks processed in Lua script execution — the higher the tick count, the higher the CPU and Memory usages are.
Below is a summary table for CPU and Memory that will be consumed in different setups. This data is based on the Feed simulator testing.
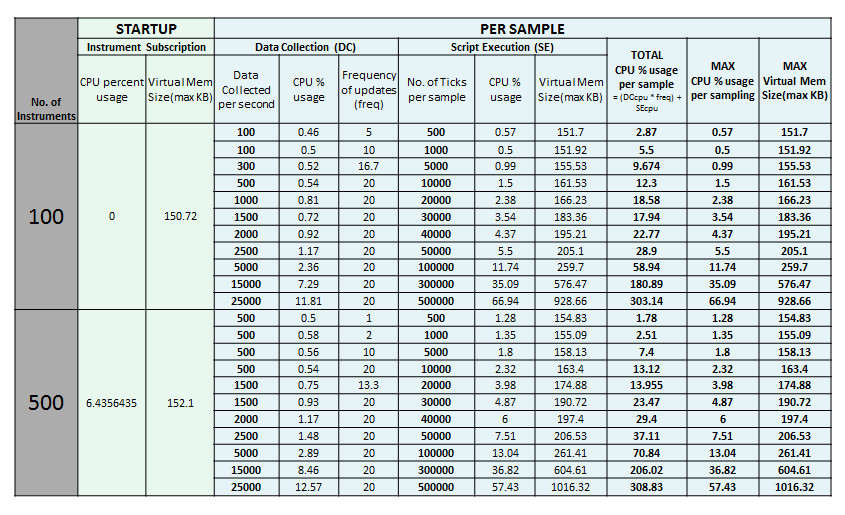
Using the data above, we can say that in this setup, processing 500,000 ticks for 100/500 instruments only consumes about 67% of the CPU and 1016KB of the Virtual Memory. It can still be stretched to 800,000 processed ticks where it may consume approximately 90% of the CPU and 1650KB of the Virtual Memory. However, processing a very large number of ticks will slow down the Netprobe significantly, and might result in undefined behaviour.
Emulate the FLM plugin using MDM
The following example shows how to configure the MDM plug-in to produce output similar to that of the Feed Latency Monitor (FLM) plug-in. The example shows how to run the latency algorithm, and how to separate sampler logic from the sampler configuration.
The example MDM sampler script generates three dataviews named LATENCY, DETAILS and VALUES. This script only covers these core features of FLM. Advanced features of FLM, such as value and time thresholds or logging are presented in other sections. Further features (such as HTML reports) are not covered in this guide.
Configuration file
Configuration for the sampler is entered in the
configuration script, which by default is flm_to_mdm_config.lua. You will need to
edit the feed, instrument and field sections.
To calculate relative latency between feeds, you will need to:
- Define a "base" feed. Latency offsets for the other configured feeds will be always calculated against this feed.
- Define at least one "comparison" feed.
- Each comparison feed must have at least one instrument in common with the base feed.
- Each comparison feed must have at least one field in common with the base feed.
Instruments
To configure the instruments, populate the
config.instrument.names variable with
a list of instrument names. These names should be short
and descriptive, as they are used for display in
dataviews.
You should then configure the instrument code for each
of these instruments, for each named feed in your
configuration. These are added to the config.instrument.codes table.
You can enter the instrument codes explicitly, as shown below for the "baseFeed" feed. In this case, the order of the field codes must correspond with the order of the feed names.
Alternatively, you can use the makeInstrumentGroup function provided
by the configuration script, as shown below for the
"compFeed" feed. This function substitutes each
instrument name in turn into the given format, emulating
the instrument group functionality of FLM.
The instruments section in the unedited configuration file is as follows:
-- Instrument configuration
config.instruments.names             = { "GBPEUR",                      "GBPJPY",                       "GBPUSD" }
config.instruments.codes['baseFeed'] = { "//blp/mktdata/GBPEUR Curncy", "//blp/mktdata/GBPJPY Curncy",  "//blp/mktdata/GBPUSD Curncy" }
config.instruments.codes['compFeed'] = makeInstrumentGroup("//blp/mktdata/%s Curncy")
-- Add instruments for additional feeds here
Fields
Fields are configured in a similar way to instruments.
Field names used for display are defined by config.fields.names, and the field
codes for each feed in the config.fields.codes table.
An example from the configuration file is shown below:
-- Field configuration
config.fields.names             = { "Trade",      "Bid", "Ask" }
config.fields.codes['baseFeed'] = { "LAST_PRICE", "BID", "ASK" }
config.fields.codes['compFeed'] = { "LAST_PRICE", "BID", "ASK" }
-- Add fields for additional feeds here